
SCCM Deployment Dashboard
View your full deployment severity, forecasts and live OS deployments!
Overview
Some of the challenges normally faced with SCCM is normally the issues which could possibly arise from carrying out any kind of deployment, and proceeding with caution to not disrupt service and cause any issues whilst performing any kind of deployment.
Though you can perform the Test/Phase deployment to a collection in SCCM, you may see which devices will receive them successfully or not, but one thing you may not see is the actual severity of the deployment you are carrying out.
And this dashboard was developed to provide a solution to
see everything and have a forecast on anything you may push out.
This dashboard similar to the previously released SCCM Software Update dashboard displays a SPOG (Single Pane of Glass) to all of your deployments
Application Compliance
This portion of the dashboard just gives a summary of everything you have in terms of Applications and Packages within your estate, which both charts contain a drill-down into your Application and packages.
Another handy part to this is a table which gives a breakdown of the most installed applications per Device and Per User. These tables also provide a drill-down which will show you each individual machine or user that holds this application.
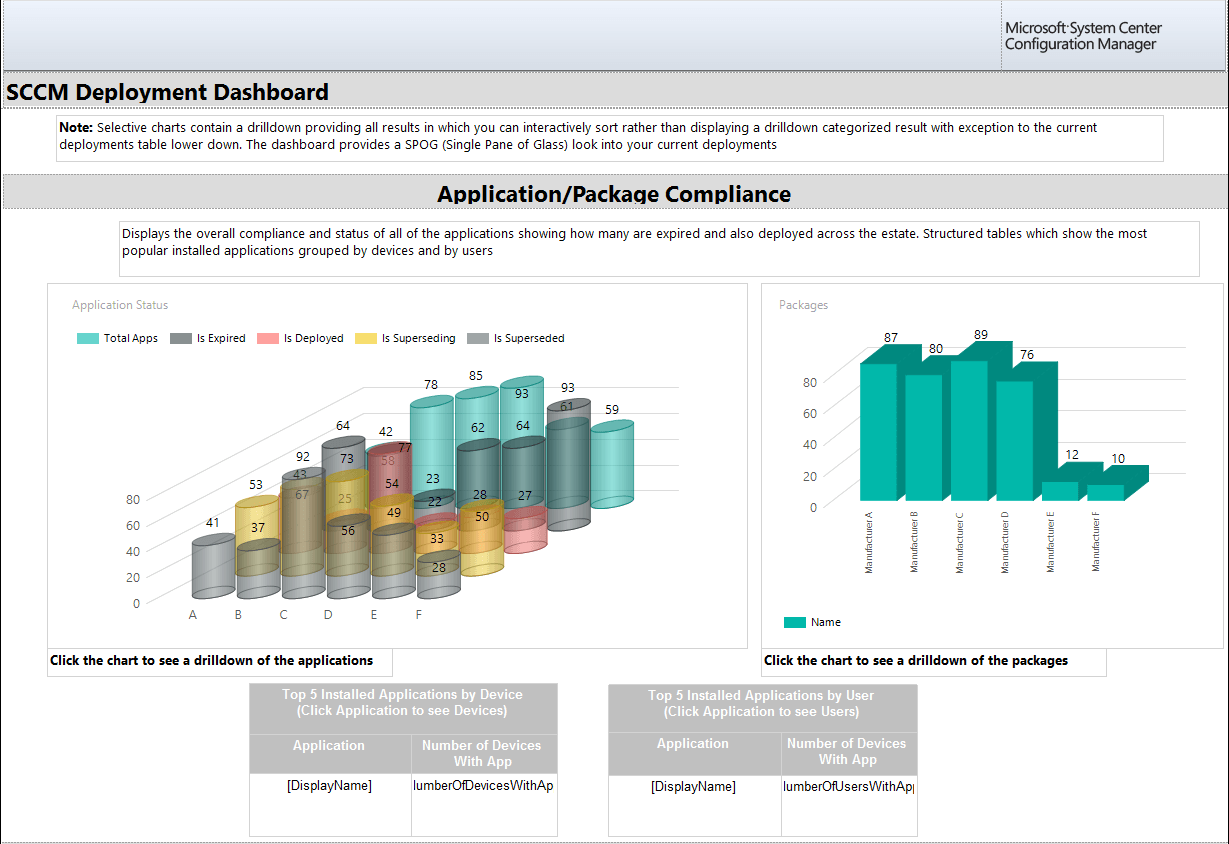
Figure 1.1 – Application/Package compliance section
Collection Severity Forecast
The next section focuses on what the potential of a future deployment would be if it were to be pushed to a specific collection.
By default it will pull out a summary for the “All Desktop and Server Clients” collection unless another collection is stated.
It will then provide a breakdown of the following;
·How many OUs will be affected and the count of devices in each
·How many departments in the business will be affected and a count of how many users in each department would be affected
·Details of the specific collection which would hold relevance such as its Limited Collection, Total Devices, Total users and departments
·Severity Gauge – Used to assess the severity of the potential deployment. It Is currently worked out by the amount of unique departments affected as an idea but this can be changed according to your needs.
·A Forecast table which shows how many devices are online and offline, thus working out a number of how many devices are expected to receive a successful deployment
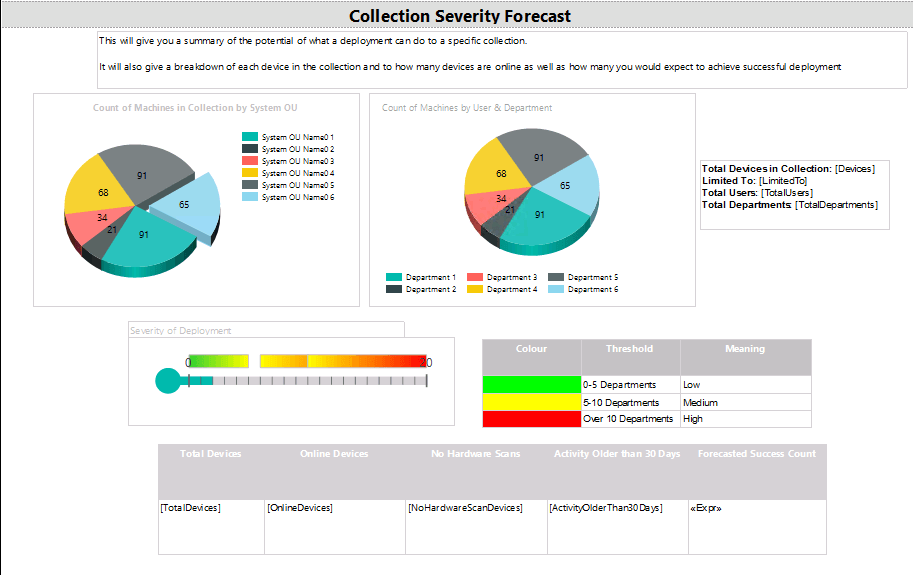
Figure 1.2 - Collection Severity forecast section
Application Deployment Compliance
The focus on this section is a combination of the Collection Severity forecast capabilities, however as these focus specifically on actual running application deployments more information will be displayed.
· Deployment Compliance – Here you will see a list of stats from the deployment such as the Number Successfully installed, in progress, errors, requirements not met etc
· Severity Compliance – Used to zero into the actual collection to which the current deployment is running on and does a similar breakdown of what the collection severity forecast section does with the breakdown of devices by OUs, and users by Departments breakdown.
· Assignment Details- This box shows all of the deployment detail settings so you can see exactly when and how it has been deployed, alongside a breakdown of the collection details
· Severity Gauge – Used to assess the severity of the potential deployment. It Is currently worked out by the amount of unique departments affected as an idea but this can be changed according to your needs.
Also instead of having a drill-down for this section I’ve added a live table which details all of the devices within this deployment including full asset details as well as its current status within this deployment which reflects the stats in the Deployment Compliance chart.
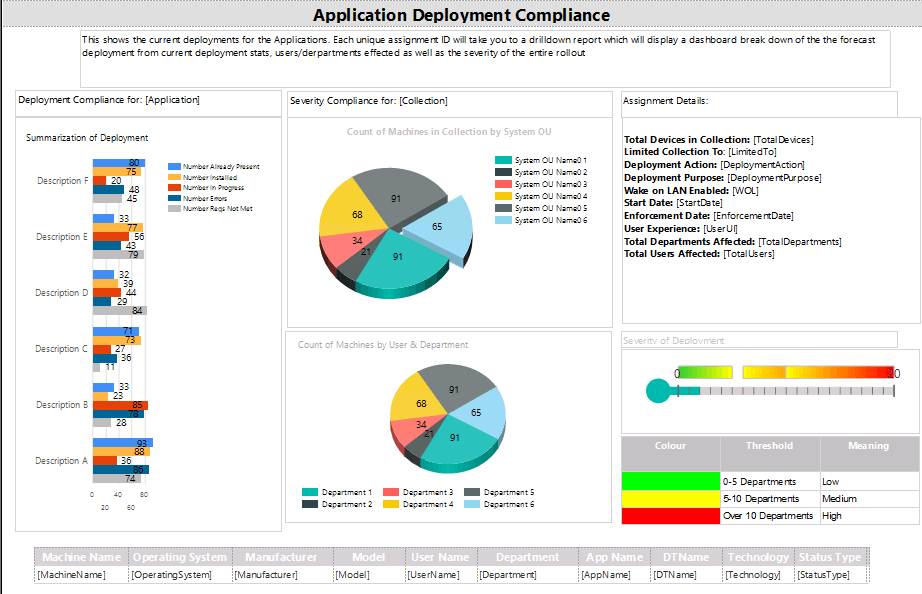
Figure 1.3 - Application Deployment Compliance section
Package Deployment Compliance
The focus on this section is a combination of the Collection Severity forecast capabilities, however as these focus specifically on actual running package deployments more information will be displayed.
· Deployment Compliance – Here you will see a list of stats from the deployment such as the Number Successfully installed, in progress, errors, requirements not met etc
· Severity Compliance – Used to zero into the actual collection to which the current deployment is running on and does a similar breakdown of what the collection severity forecast section does with the breakdown of devices by OUs, and users by Departments breakdown.
· Assignment Details- This box shows all of the deployment detail settings so you can see exactly when and how it has been deployed, alongside a breakdown of the collection details
· Severity Gauge – Used to assess the severity of the potential deployment. It Is currently worked out by the amount of unique departments affected as an idea but this can be changed according to your needs.
The table below shows a breakdown of each device with full asset details showing not only the Package Name but also program name deployed alongside its current deployment status.
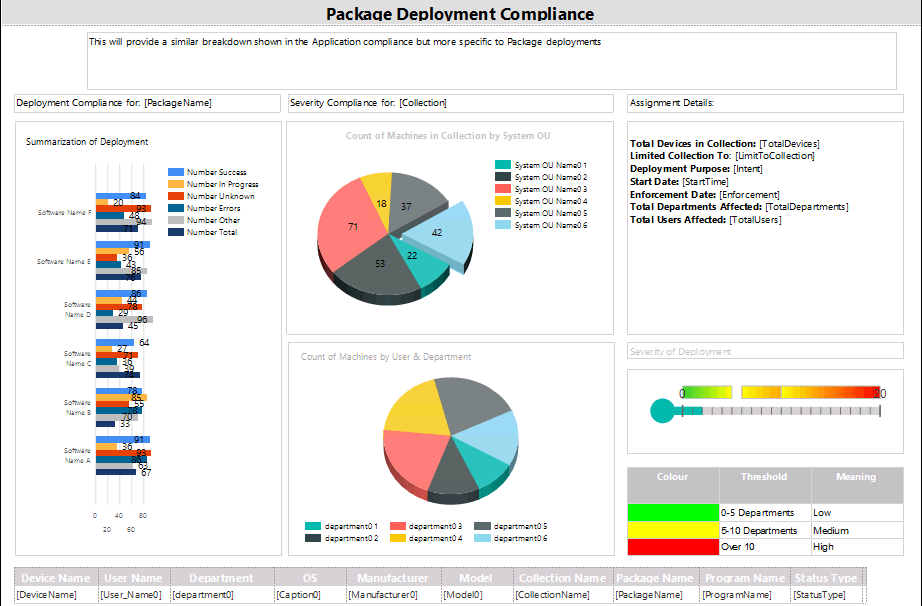
Figure 1.4 - Package Deployment Compliance section
Operating System/Task Sequence Deployment Compliance
This section is very different from the rest of the dashboard due to its focus on Task Sequence deployments.
It does contain a deployment compliance chart, but it also contains a table which displays a list of all of the applications/packages which are referenced in the Task Sequence which is handy when either needing to edit or delete Task Sequences which don’t always give a clear indication on what its dependencies are.
Assignment details are also provided to show when it was deployed.
The table below is a live table which shows all of the current PXE deployments within the last 24 hours, and as most deployments could reside from the “All Unknown Computers” collection the table outlines specific details which can outline the machine you may have deployed to if not using any other method of naming a machine in the OSD phase such as UDI wizard or any form of MDT/ZTI Integration
·Resource ID
·Machine Name
·IP Address
·MAC Address
It also has a record of every single step within the PXE deployment so you will be able to see exactly at which step a build failed on if it did fail as well.
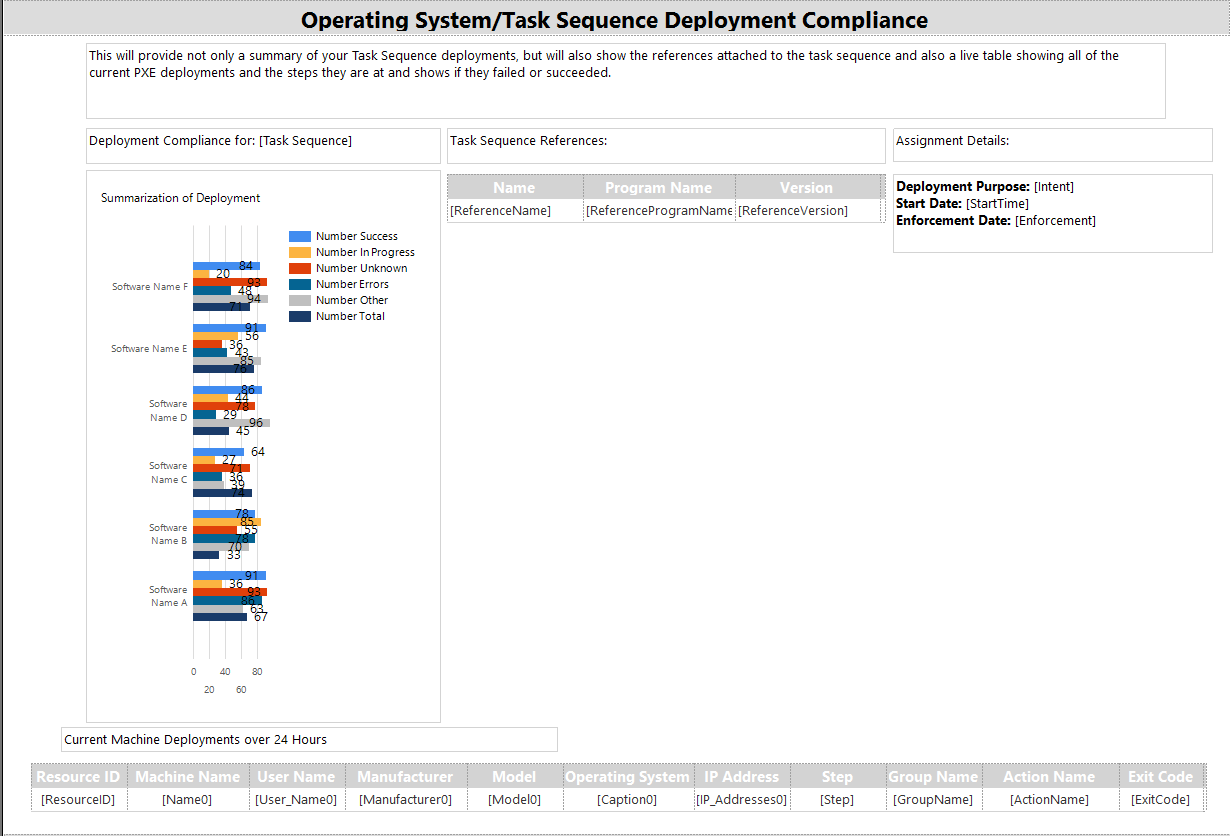
Figure 1.5 - Operating System/Task Sequence Deployment Compliance section
Configuration Baseline Deployment Compliance
The focus on this section is a combination of the Collection Severity forecast capabilities, however as these focus specifically on actual Configuration Baselines more information will be displayed.
· Deployment Compliance – Here you will see a list of stats from the deployment such as the Number Successfully installed, in progress, errors, requirements not met etc
· Severity Compliance – Used to zero into the actual collection to which the current deployment is running on and does a similar breakdown of what the collection severity forecast section does with the breakdown of devices by OUs, and users by Departments breakdown.
· Assignment Details- This box shows all of the deployment detail settings so you can see exactly when and how it has been deployed, alongside a breakdown of the collection details
· Severity Gauge – Used to assess the severity of the potential deployment. It Is currently worked out by the amount of unique departments affected as an idea but this can be changed according to your needs.
The table below shows a breakdown of each device with full asset details showing its compliance state for the baseline being deployed
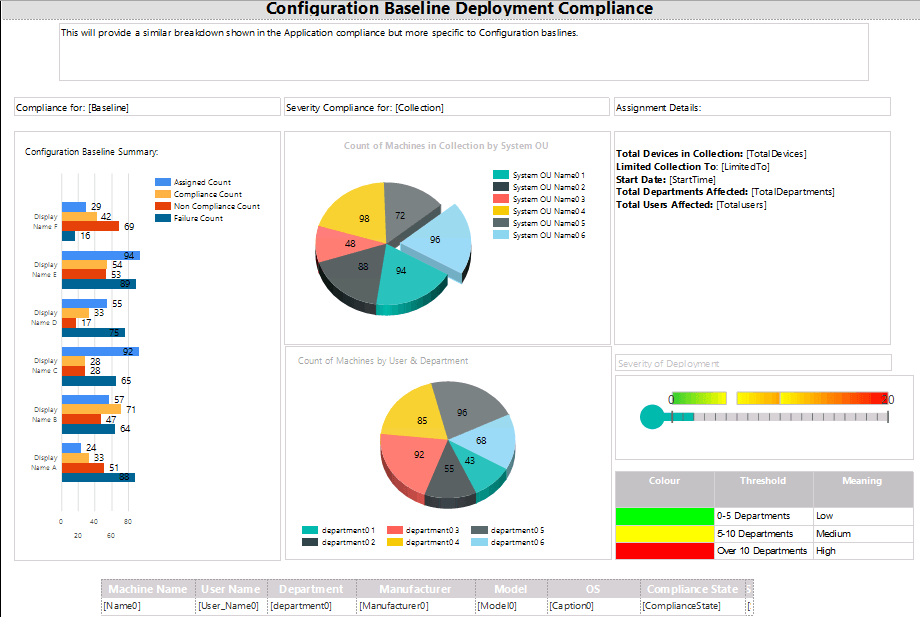
Figure 1.6 - Configuration Baseline Deployment Compliance section
Configure Drill-down reports
For the drilldown reports, you will need to add them to a folder called “Deployment Dashboard Drilldowns”
But if needing to create your own folders you can simply change the report actions on the charts within the Application/Package Compliance section.
How to run the Dashboard
Once you click run you will be presented with several parameters
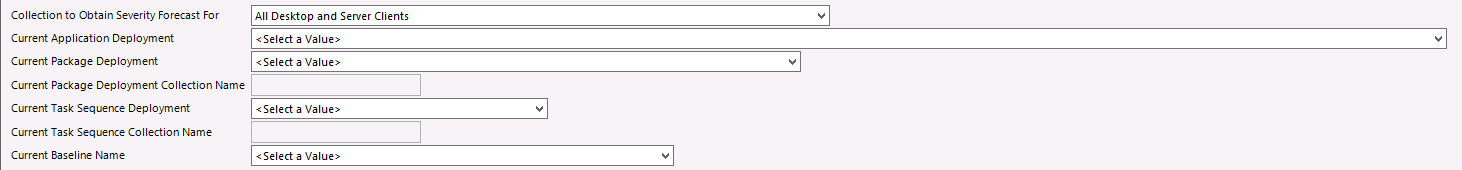
Figure 1.7 – Parameters for the dashboard
The Package deployment and Task Sequence deployments have an extra parameter which resolves to the specific collections in which have the current deployments attached to them, to refine the results in the dashboard sections
Where To Download
This can be download on technet from the following link