
Reports & Dashboard Solutions
Reports & Dashboard Solutions
Walsham Solutions is proud to announce we will be providing a service to clients and new customers to build and construct customized reports and dashboards
for all your business needs & requirements. Get in touch for a discussion, workshop design and quotes!
How we provide the service
In order to plan and design the perfect dashboard for you, we will firstly need to setup a workshop in which we can discuss the overall aim for your dashboard/report where we can start to build on the following;
• Business Requirements/Overall Goal
– First we need to understand what you are trying to achieve with the customized dashboard
• Data to Display
– Then we formulate the data which will be displayed which addresses the overall goal and requirements.
• Visualization
– Build the visualizations around the data which will be displayed.
• Design
– Finishing touches of the design of the overall dashboard.
• Provided Access
– Create the appropriate access to the relevant users/teams/stakeholders
• Demonstration/Review
– A demo of th e dashboard once completed to specification
• Training
– Optional where additional training can be provided on how to edit, filter and control the newly created dashboard which overall and ongoing support can be provided.
Please contact us on Dwalsham@walshamsolutions.com also available on Skype for Business and Microsoft Teams
Please contact us on Dwalsham@walshamsolutions.com also available on Skype for Business and Microsoft Teams
Power BI Dashboard Development
A lot of organisations require very specific and tailored data to be provided not only to the appropriate teams but also to business stakeholders. In fact, a lot of default reports in which you may get as box standard with various technologies, but can be very locked into the information they provide which is also not possible to edit or tweak at leisure.
Walsham Solutions intends to provide the perfect dashboard or report using PowerBI technology to correctly display all reporting data which you need and beyond.
The great part about PowerBI is the ability to see real-time live data being displayed and brilliant visually and can be configured so the appropriate user base can have access to run the dashboard.
What can we create dashboards for?
Walsham Solutions can create dashboards for any technology in which you desire. Various data sources in which report data can be processed from a range of;
• Databases (SQL Server, Oracle, MySQL, NoSQL)
• Cloud Technologies (Azure, SharePoint Online, Exchange Online)
• Spreadsheets (Excel, Text/CSV)
Just to give an example of the vast majority on which we can create dashboards for.
We can specialize on any kind of data in which you wish to transform, visualize and display with our versatility across all organizations whether that to be displaying sales data or any technical or statistic information required.
Power BI Portfolio
Walsham Solutions has had a lot of success in providing custom requirement dashboard specifically for technologies around Microsoft System Center technology base as an example we can use to display our portfolio.
System Center using centralized solutions are indeed huge suites of applications which have heavy information across their main databases as well as their historical databases for those which hold a DataWarehouse.
A lot of reports can come with each technology such as SCCM, SCOM, SCSM just to name a few. And though they provide great information sometimes we have improvised with what we are given because of the structure of the reports. And this is simply where Walsham Solutions comes in!
Our dashboards can be found on the Technet Gallery under my profile name and URL here where we have several thousand downloads combined across various contributions https://gallery.technet.microsoft.com/site/search?f%5B0%5D.Type=User&f%5B0%5D.Value=Dwalsham
Our dashboards can be found on the Technet Gallery under my profile name and URL here where we have several thousand downloads combined across various contributions https://gallery.technet.microsoft.com/site/search?f%5B0%5D.Type=User&f%5B0%5D.Value=Dwalsham
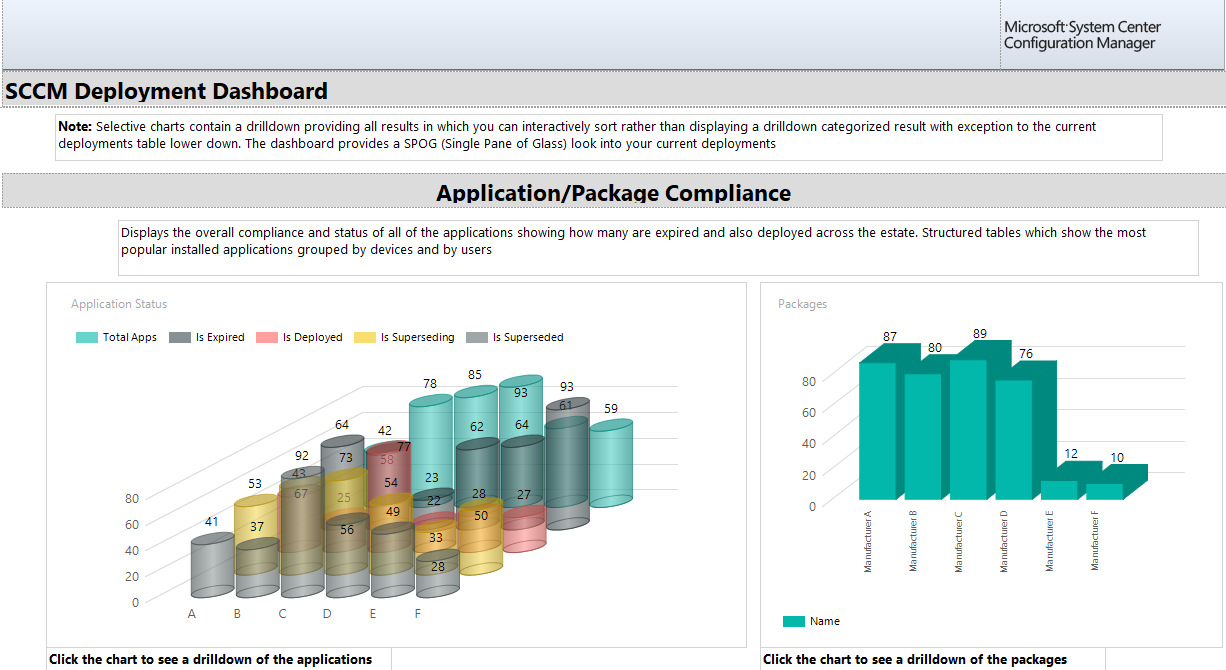
System Center Configuration Manager Software Update Dashboard
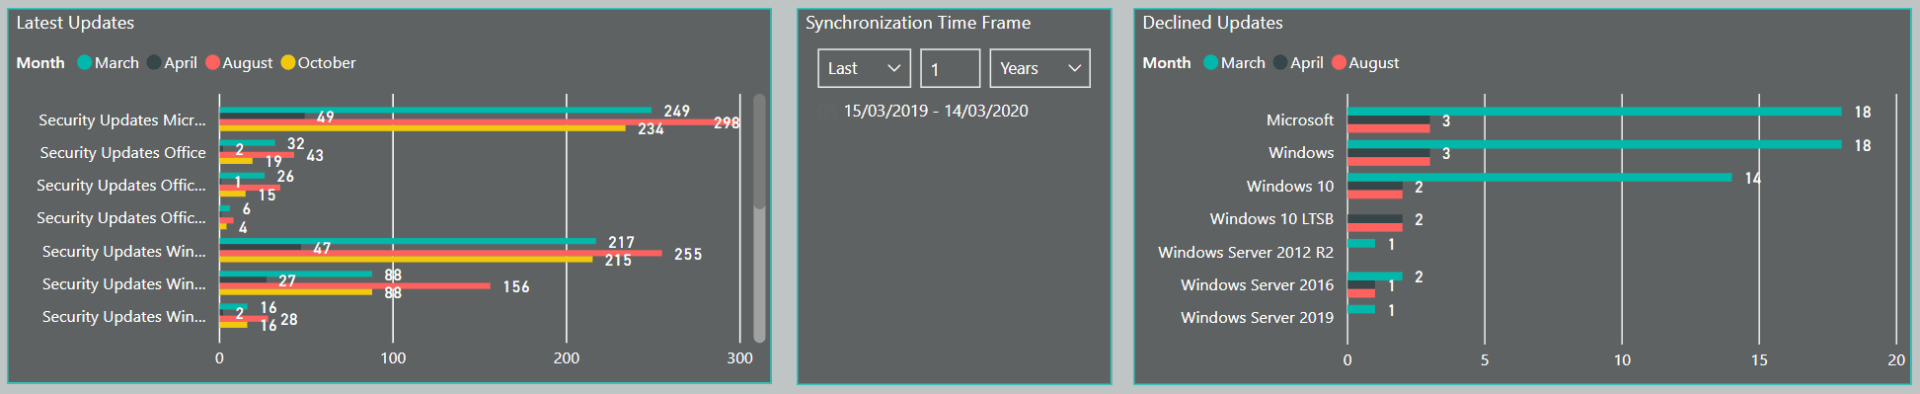
Below is an example of an SCCM Software Update Dashboard which shows statistics on synchronized updates.
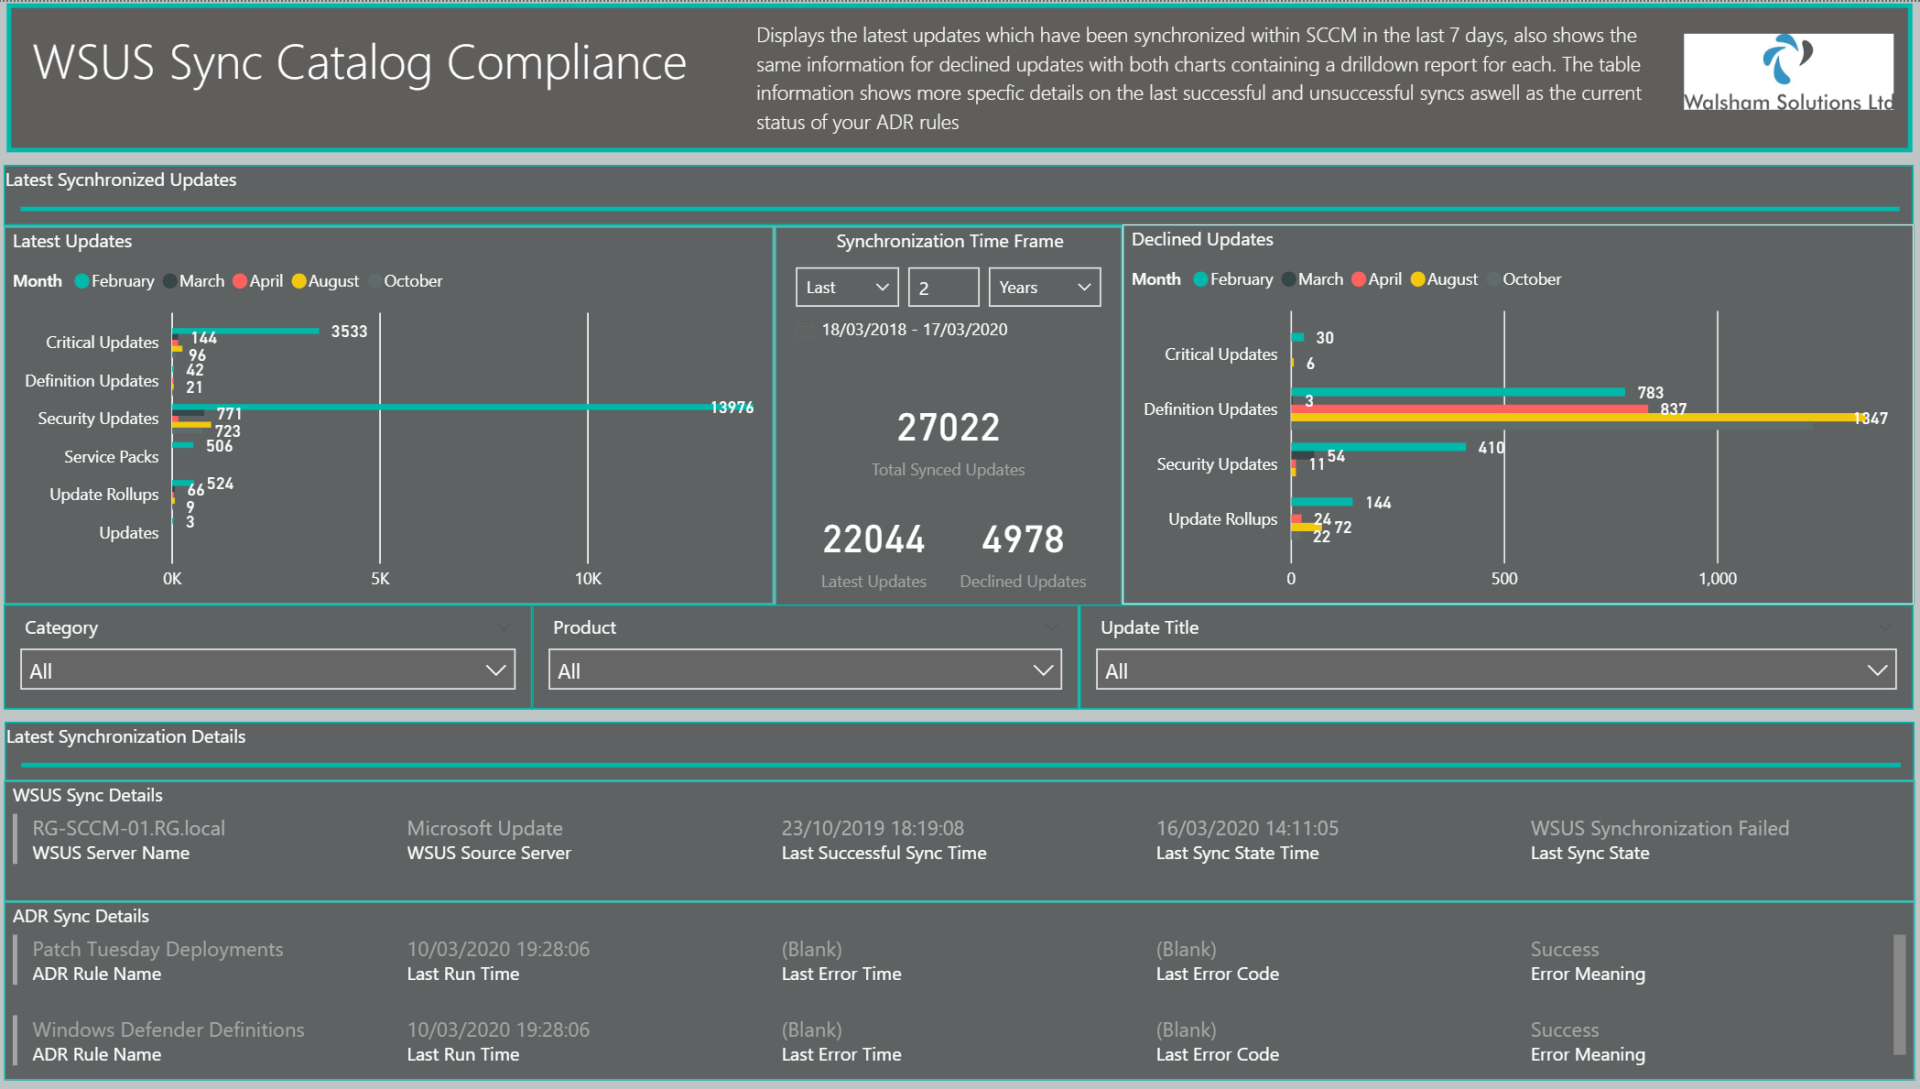
To explain in finer detail so this provides a breakdown of all of the synchronized updates which come from your Windows Server Update Services (WSUS) estate which is used to provide a patching service for windows architecture.
So not only can see the categories of each update, but we can also see the months in which they were synchronized, and a drilldown will also allow you to see the products within each category as seen below in the next screenshot.
You will also notice the overall summary of Latest updates and declined updates so you can see the perspective of each side.
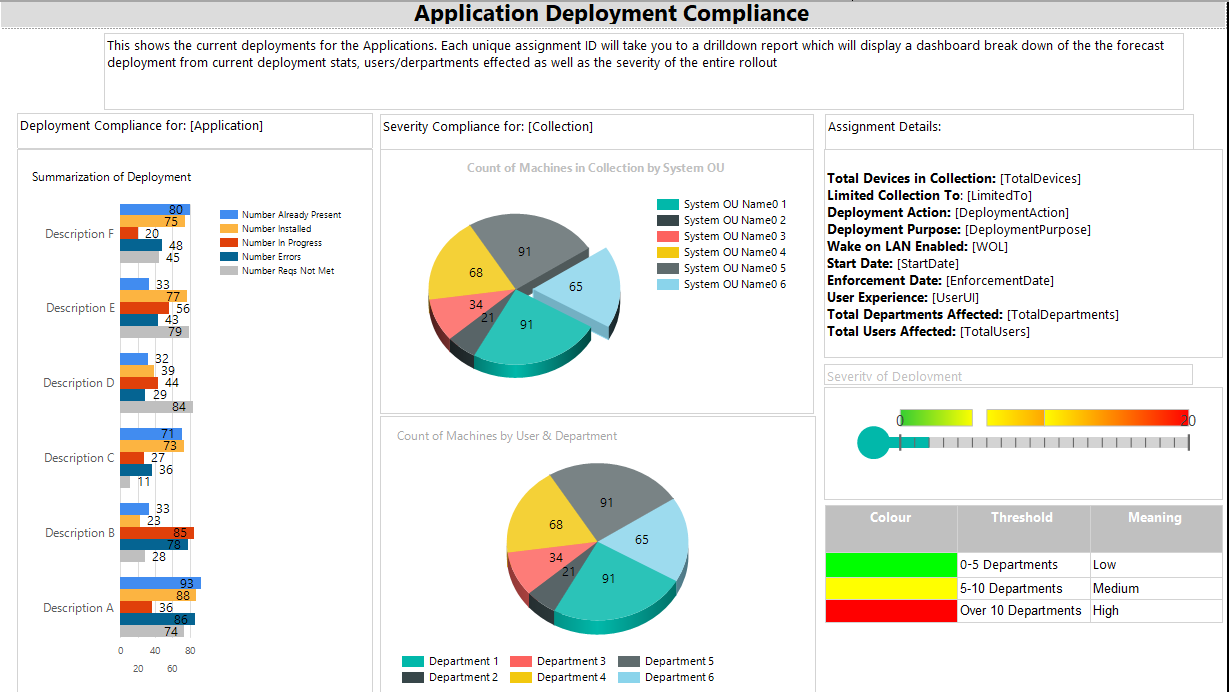
In addition, on the first screenshot you can see dropdown boxes which allow you to customize the following;
• Category
– Shows which category of updates specifically
• Product
– Filters down to the exact product of updates synchronized
• Update Title
– Filters down to the specific update synchronized if required to find a specific one
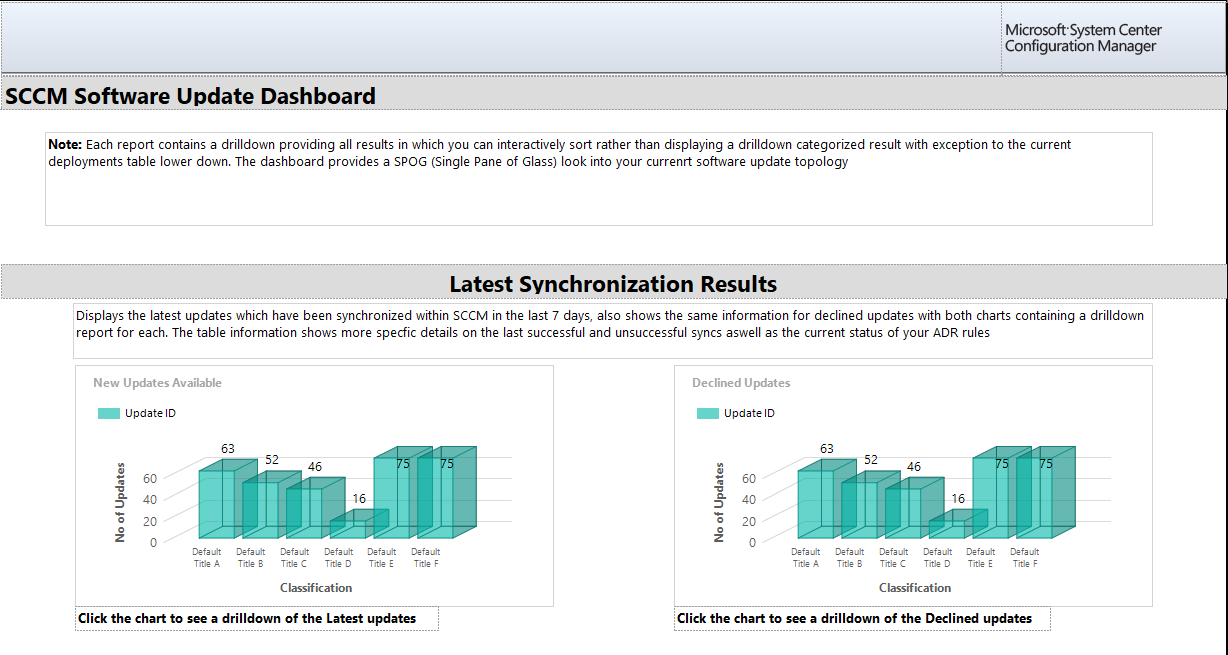
We also implement error handling on this report below where you can see the synchronization details of the WSUS technology and also the ADR (Automatic Deployment Rules) which can grab specific updates for deployment, you can see an additional attribute for Error Meaning which is our embedded error handling to provide a friendly description to the error which it may or may not have.
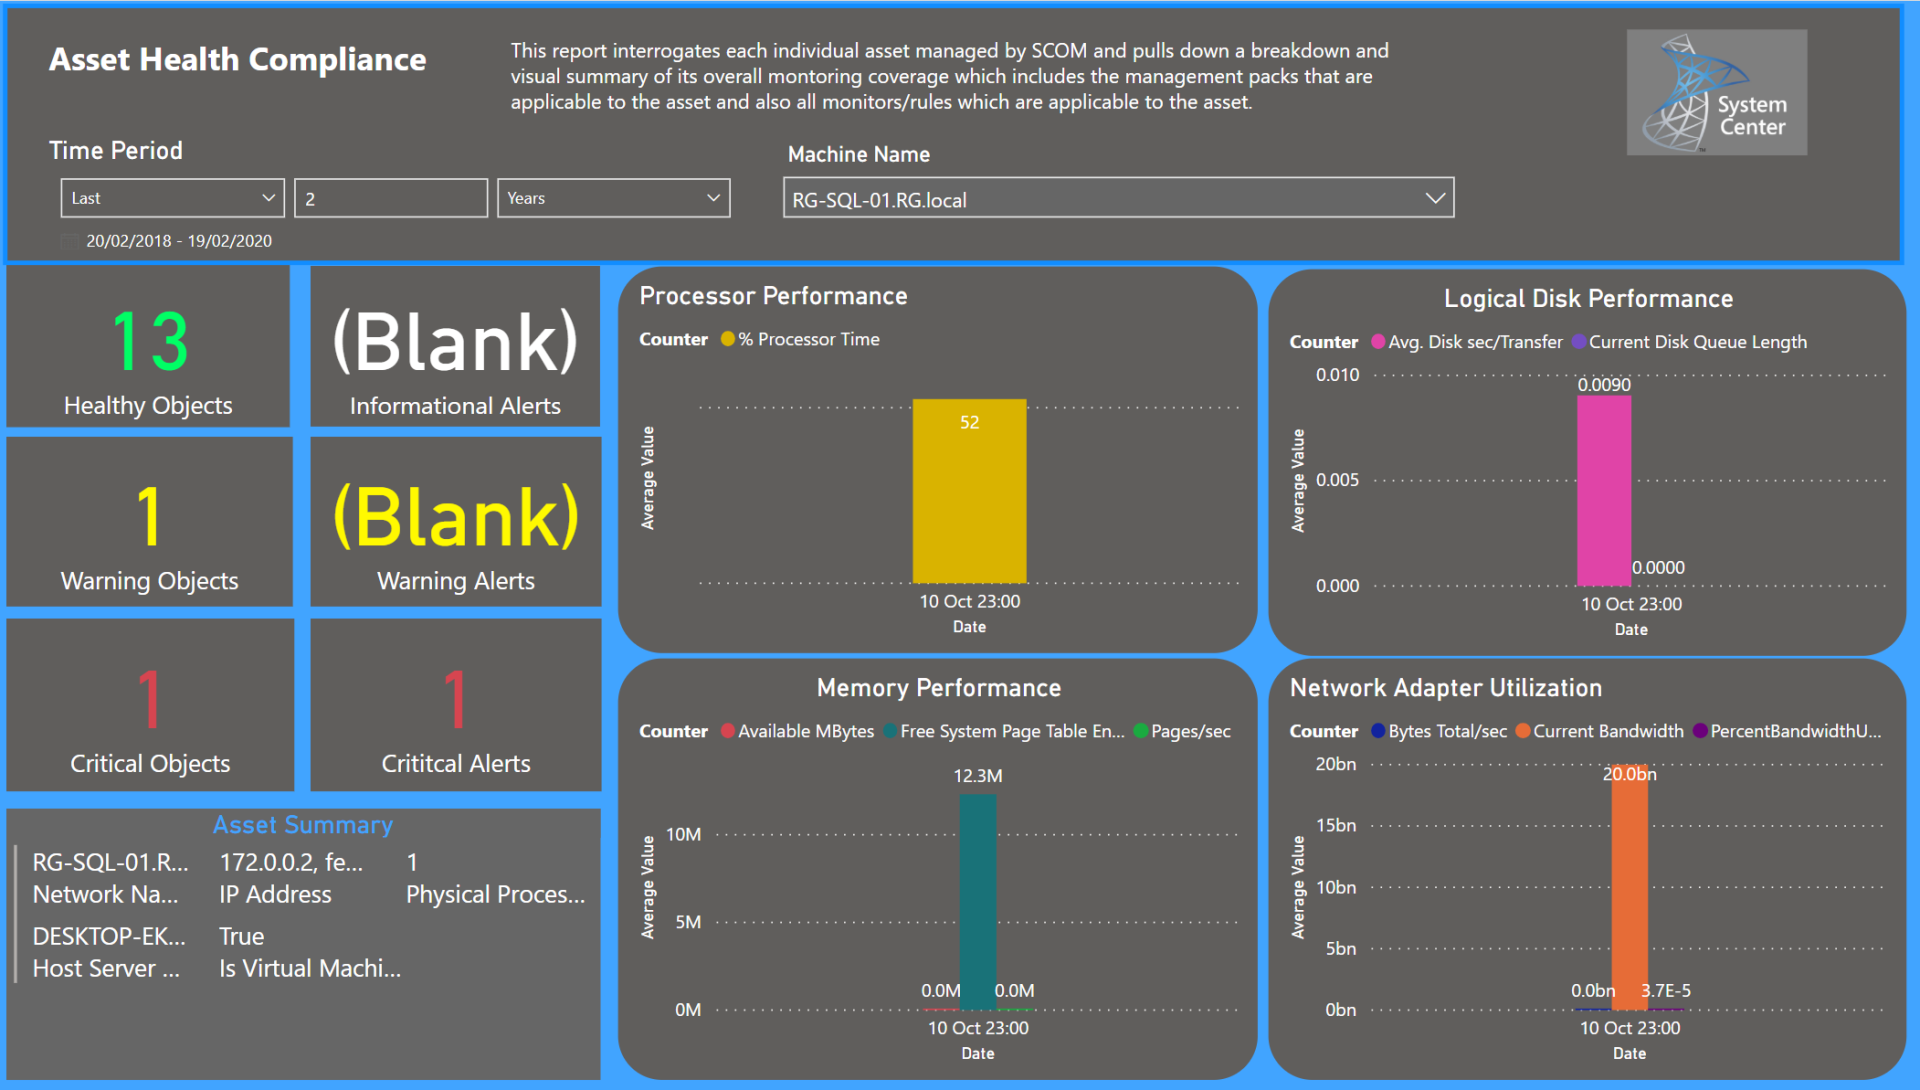
System Center Operations Manager Compliance Dashboard
Another example in which we have is specific for SCOM being the centralized monitoring the solution within the System Center suite.
This is a great example due to the great amount of data displayed within its DataWarehouse as well as health and performance statistics which can be extracted from perfmon counters.
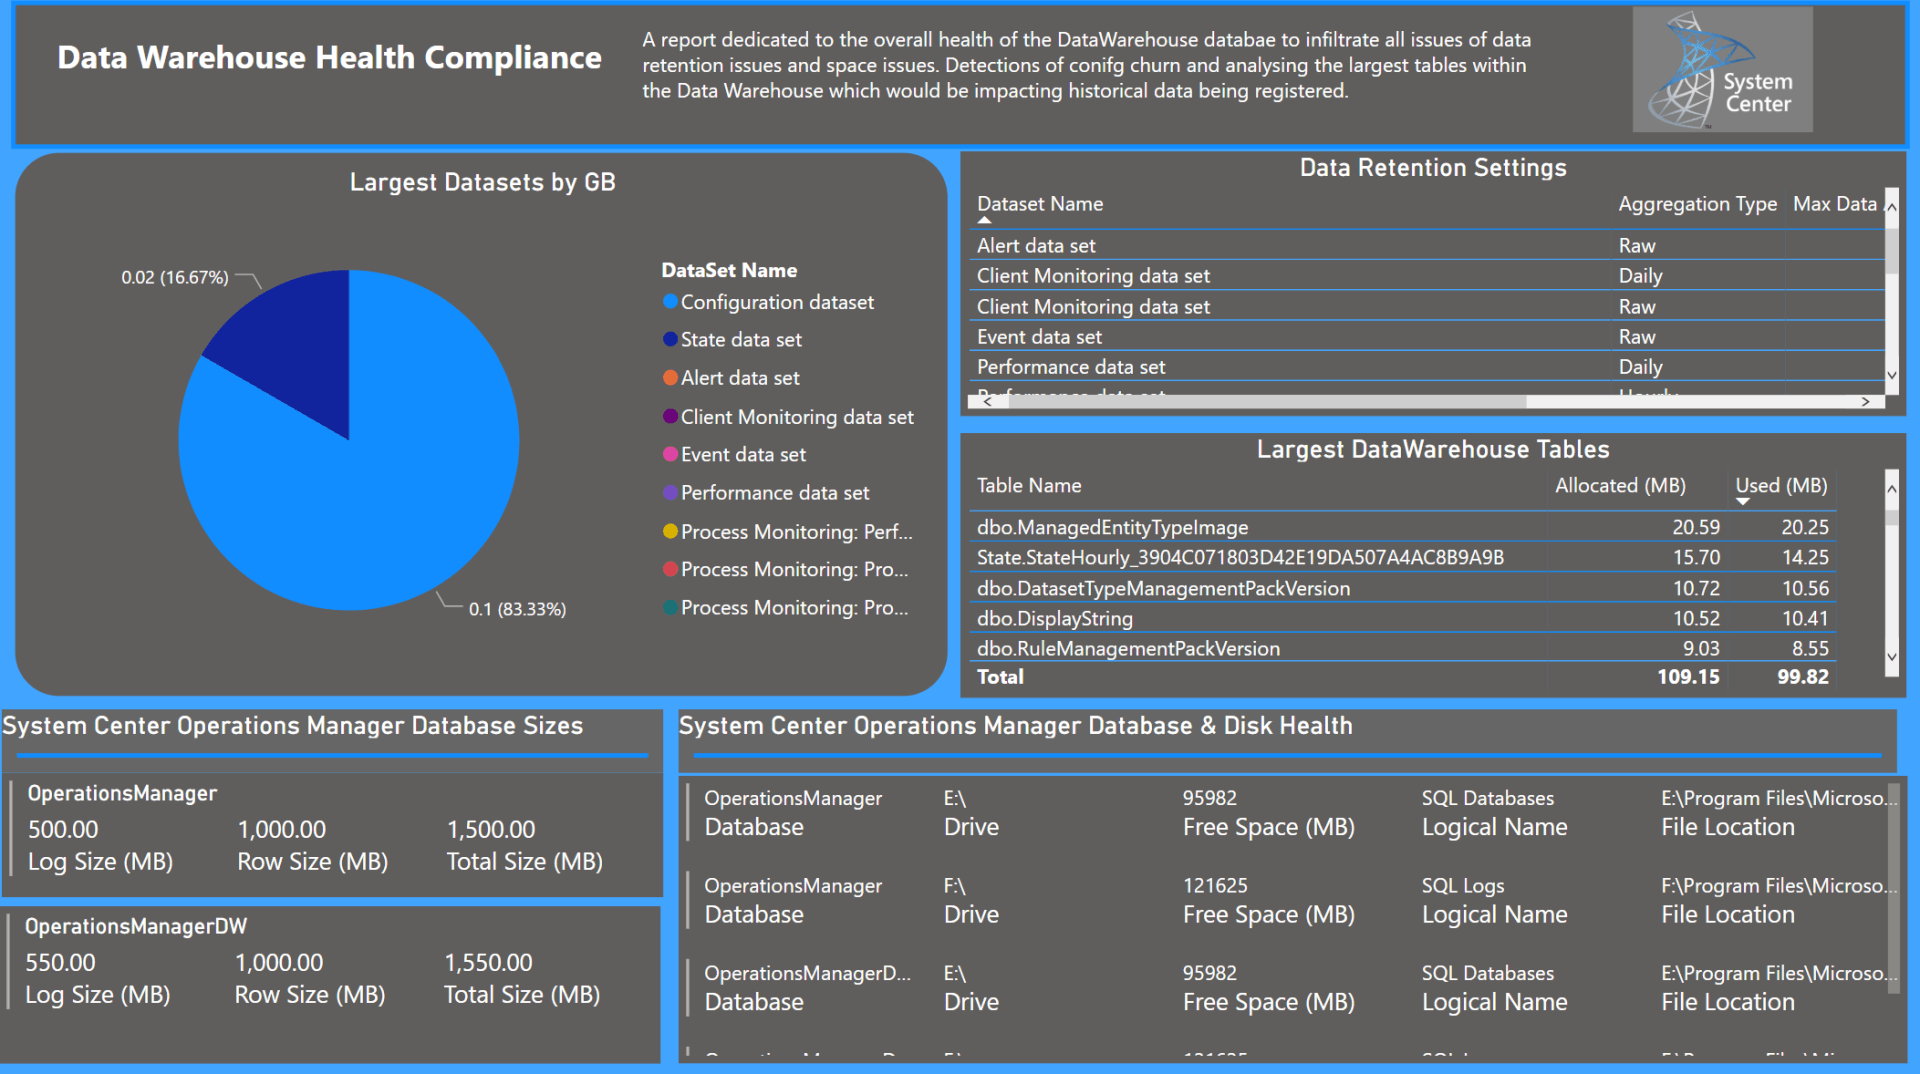
Above is a screenshot of the SCOM DataWarehouse health compliance. Here is where all historical data is kept and processed such as the following;
• Alerts
• Discovery Data
• Monitoring Data
• Performance Counter Data
• State Data
Now here we see a comprehensive breakdown of the largest tables and largest datasets of the SCOM DataWarehouse so we can see where is impacted the most thus warning the SCOM administrator/s on what to look for.
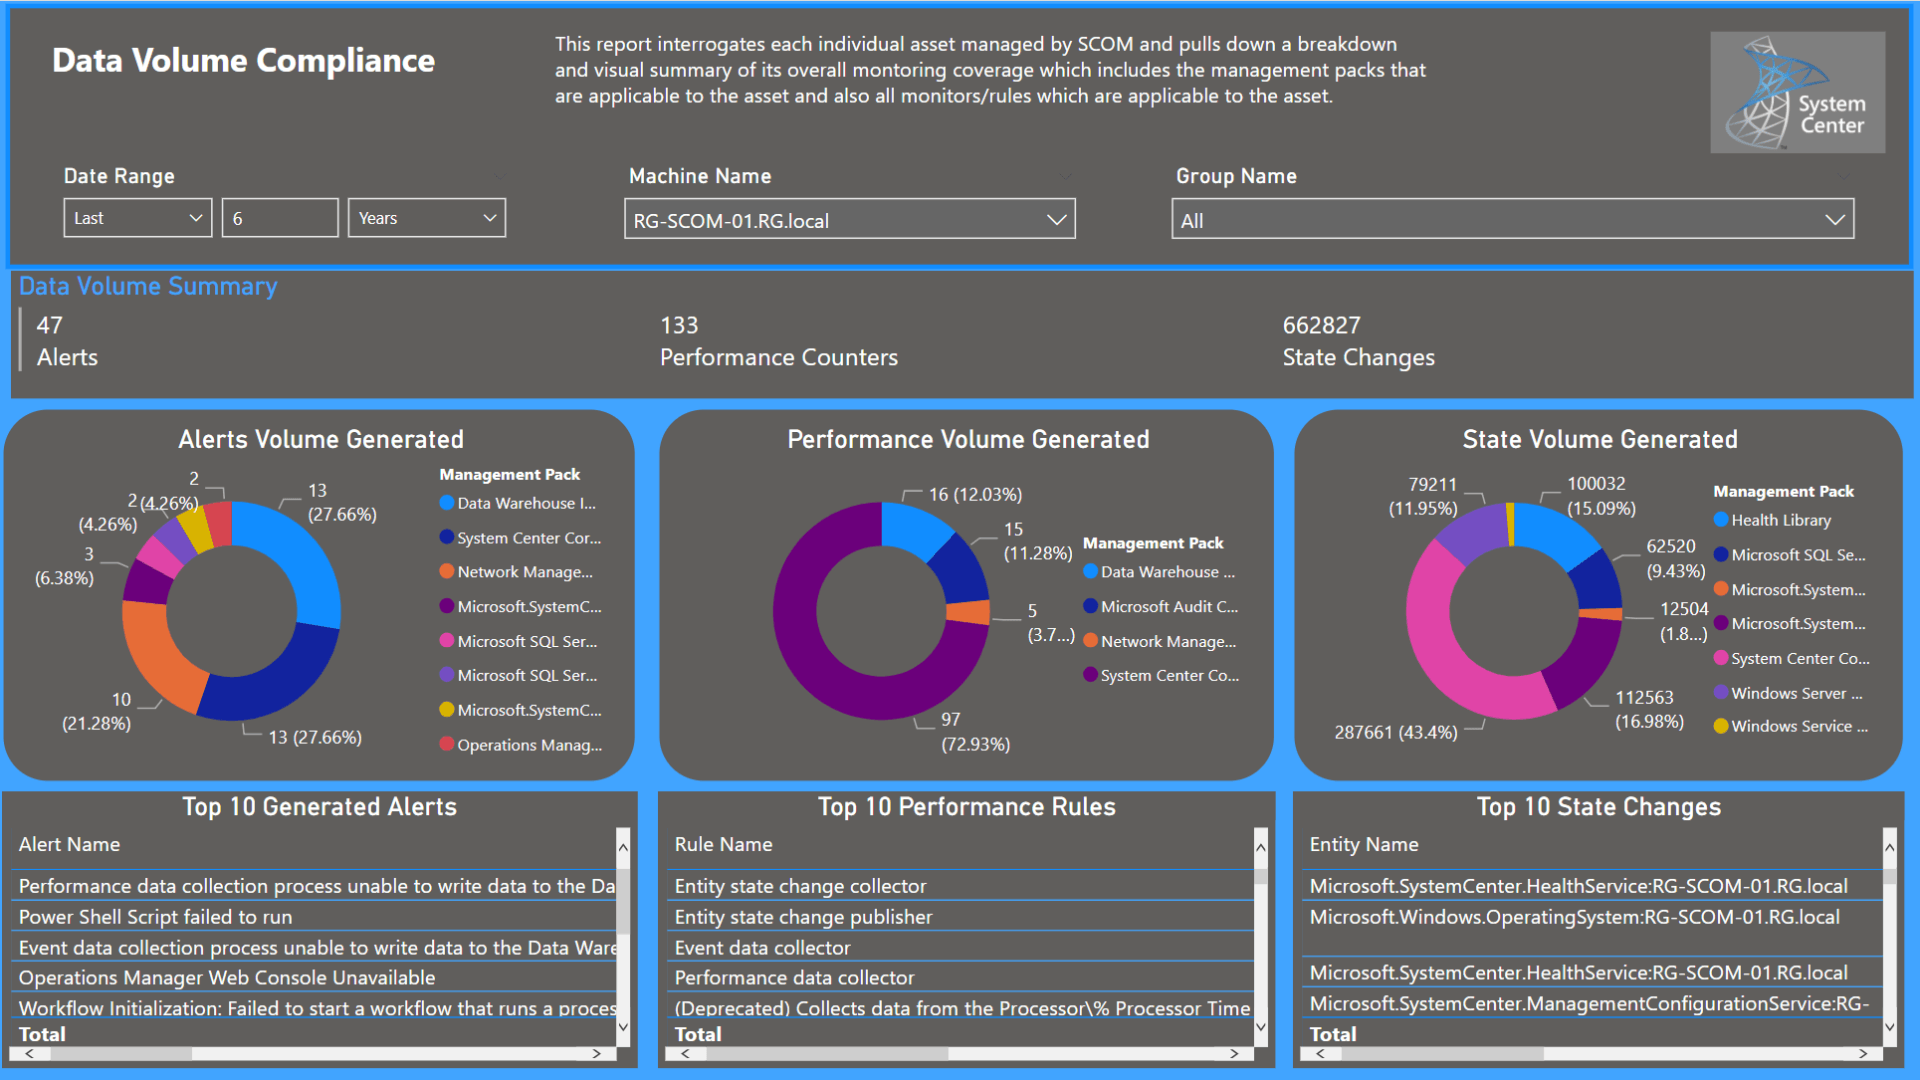
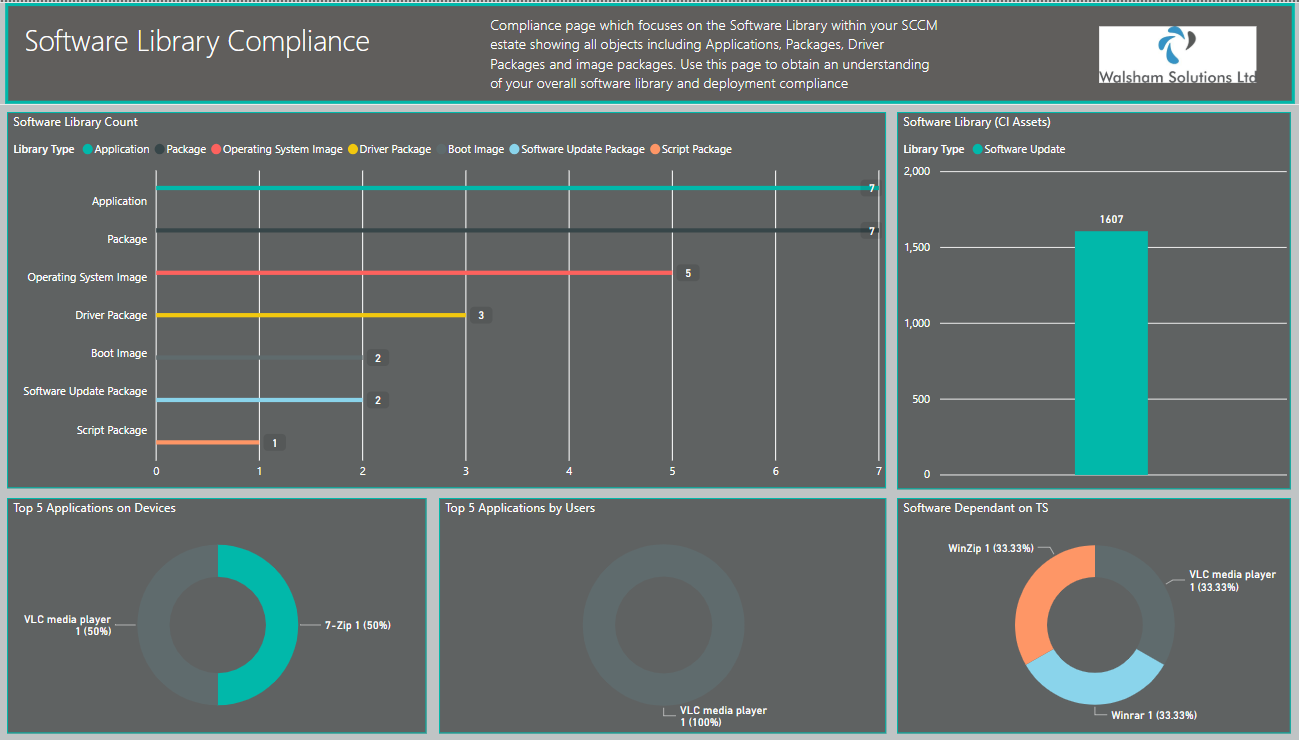
The next screenshot of the dashboard is the Data Volume Compliance, which is a very insightful page. SCOM already does have a box standard report which shows this, but in this case this is a lot more specific to each monitored asset providing event greater specific detail to the volumes of data created by each and all.
Show all from top 10 of each data category and can be spread over any range specified by the end user.
Paginated Report Solutions
We also accommodate all available options across report and dashboard solutions which also includes paginated reports in .rdl format for those which require more available options around historical snapshots, scheduling of export options and linked reports.
Below are some examples of our Paginated report designs.


Contact
Address
W8a Knoll Business Centre,
325-327 Old Shoreham Road,
Hove,
BN3 7GS
Copyright © Walsham Solutions Ltd 2018.
Reg. No. 8733038