
MEMCM Device Dashboard
Ready for consultation for implementation through Power BI service!
Introduction
With the long waited and anticipated revealing, Walsham Solutions LTD now introduces a brand new dashboard which is engineered specifically for MEMCM and is developed with a dashboard available on the Power BI service.
This overall solution contains not only a live dashboard which displays a phenomenal amount of information to paint the overall summary of your entire MEMCM estate, but also additional highly developed pages which correspond to each summarized widget to expand further on CMDB information.
Aim of The Dashboard
Through many years of developing solutions across various clients and organisations with different requirements across the spectrum when it comes to reporting and any kind of report analysis, it's very difficult to standardize in such a way in which a report/dashboard solution can be applicable to all. And this can range from SLAs, SLOs to very specific drilldowns in which MEMCM may contain but require additional work through an advanced SQL/WQL, PowerShell SDK or even having to extend classes to obtain.
Whilst various dashboards which Walsham Solutions have developed have been more related to specific groupings of priority such as the Software Update Dashboard & the Deployment Dashboard. They are very advanced and standardized dashboards but they are more locked specifically to focus on collectives of assets.
This dashboard here is specific and developed to focus more on the individual asset as opposed to the collections perspective. One thing that always remains very true in terms of report detail is to know the full asset inventory detail or a specific detail to just one machine
.
This can range from anything from a "Last Logged On User" or a "Last Hardware Inventory Scan" or even to know more intricate details as to its connections and where its connected to in terms of Intune/Co-Management etc The fact is not only are these details of keen interest to other teams and stakeholders, but they are even more of interest to administrator as these fine details can also point out where bigger issues lie as well as being able to constitute for a full comprehensive analysis on a per asset basis.
New Features
This dashboard has a lot more interesting features than the previous dashboards which have been released in the past and below are the overall USP of this new creation;
- Live Service Dashboard - This dashboard specifically on the Power BI service will display a detailed summary of everything within you MEMCM estate with each visual being a great representation on giving a SPOG (Single Pane of Glass) illustration on all of your assets.
- Full illustrated Resource Explorer - Displaying of all hardware inventory information thus switching logos to represent the assets Manufacturer and Operating System.
- Full Cache Compliance - You can now see all of the history within a devices CCM Cache which downloads all of the content specifically for that target device which now displays all folders, files and a full analysis of date trends and sizes.
- Real-Time Client Log File Analysis -
You can now be able to look at the last 5 - 15 lines of key log files which are created on your assets which are monitored by MEMCM to obtain not only a deep analysis of your assets but also not needing to be present at the machine physically anymore.
- Analysis of all Asset Connections -
You will be able to see the status of every kind of connection which the asset has access to. For example you can see if the machine can be pinged, can be RDP'ed and Remote Controlled. Others include connectivity status to a CMG, Co-Management, Azure AD Tenancy and client health results status.
- Advancements on Network Assignments -
Now you will be able to see not only which Management Point an asset belongs to, but you will now be able to see exactly which Boundary it belongs to and which DPs & DP Groups they are assigned to, which allows you to see exactly where its distributions will arrive from.
- Enhanced Tooltips -
Specific visuals will reveal important tooltips that display more additional data to compliment the specific information in which you are looking at.
How to get the Dashboard Solution
The solution will require implementation from Walsham Solutions so that this can be tailored specifically to each individual customer as many will have different requirements as well as setups when it comes down to your Power BI licensing model.
Pricing is varied as we have two versions in which we can provide the implementation for;
- Live Service Version - This would be the dashboard setup within the Power BI service where in addition you would also be able to utilize the Live Service Dashboard below and be able to use your dashboard solution within the cloud. This is a great way of also connecting to your resources if you are using Azure SQL or any other resources within the cloud. Course you can also have gateways setup to your on-premise servers if required so
- On Premise Version -
This would be more the offline version or similar to which have been released from WalshamSolutions
in the past, where the dashboard can be used in a standard Power BI Desktop application perspective and would be using a manual refresh to keep everything up to date which is still also extremely effective depending on your requirements.
Please get in touch on dwalsham@walshamsolutions.com for a further consultation and implementation plan
MEMCM Device Dashboard
Below we will go through each individual report of the overall solution and dashboard and provide great detail as to the overall features and unique selling points of each
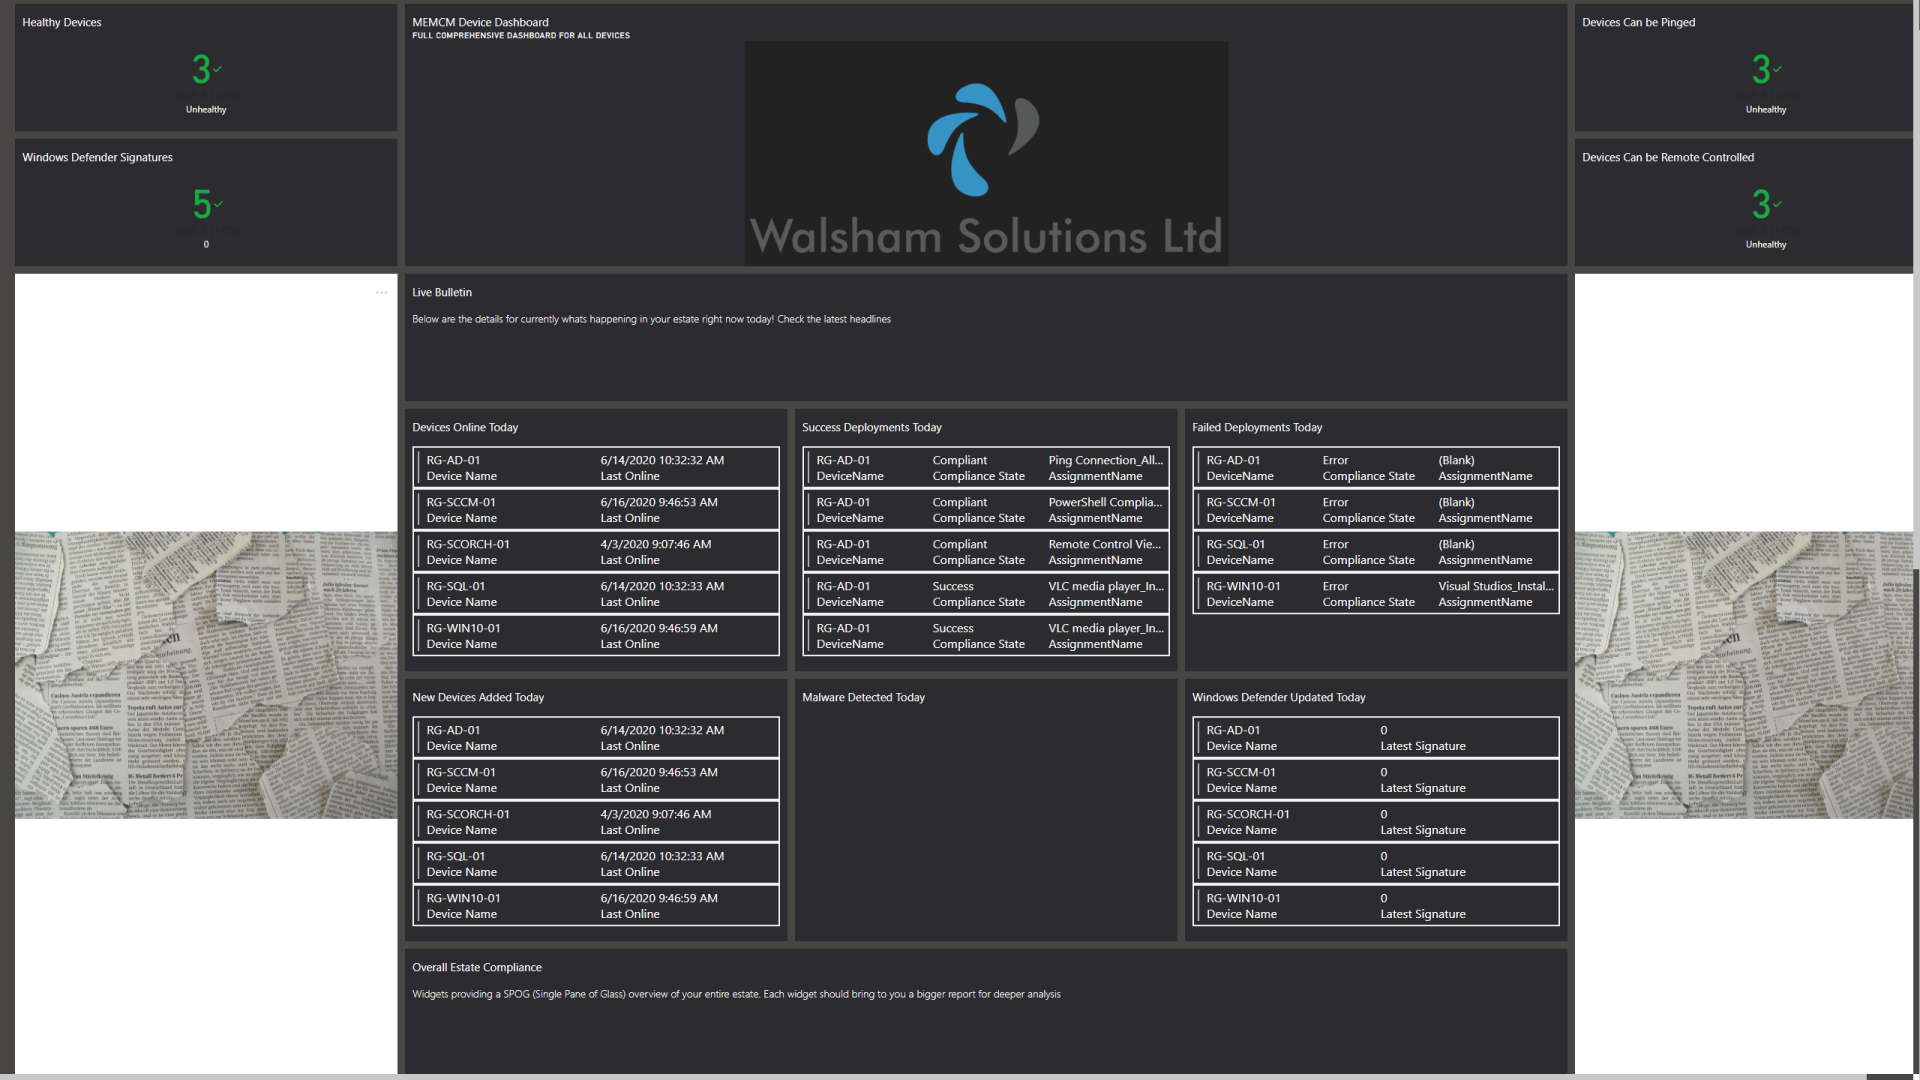
Live Service Dashboard
Available for those who wish to utilize the Power BI service report model of this solution, this is the live dashboard which consolidates your overall estate of device compliance which range from various visuals which provide by a summary for each individual report within the MEMCM Device Dashboard solution.
A very special and helpful feature in this case is the Live Bulletin
widget which aims to display all of the latest information with your devices which have happened specifically today!
The whole idea was to make it like a news bulletin or today's newspaper to see the latest news, in this case the top headlines will be whats currently happening in your estate right now
This can range from everything such as;
- New Devices Added Today - See all of the devices which have just been built today
- Devices which have turned healthy - See all of the devices which have turned into a healthy state or are in healthy state
- Devices Which have turned unhealthy - See all of the devices which have now an unhealthy state
- Devices successfully got deployment - See the compliance of successful deployments to machines today
- Devices failed deployment - See the compliance of failed deployments to machines today
- Devices detected a virus/cleaned - See the machines which have had a virus detected today
The black tiles in which you see next to the company logo are KPIs which display the current amount of devices within your estate which are deemed as healthy, contactable or successful compared to the devices within your estate as well as a minimum target in which ideally we would like to hit which has been currently capped to 80% by default but this of course can be changed
Further than we can see the overall section which provides the following widgets and features;
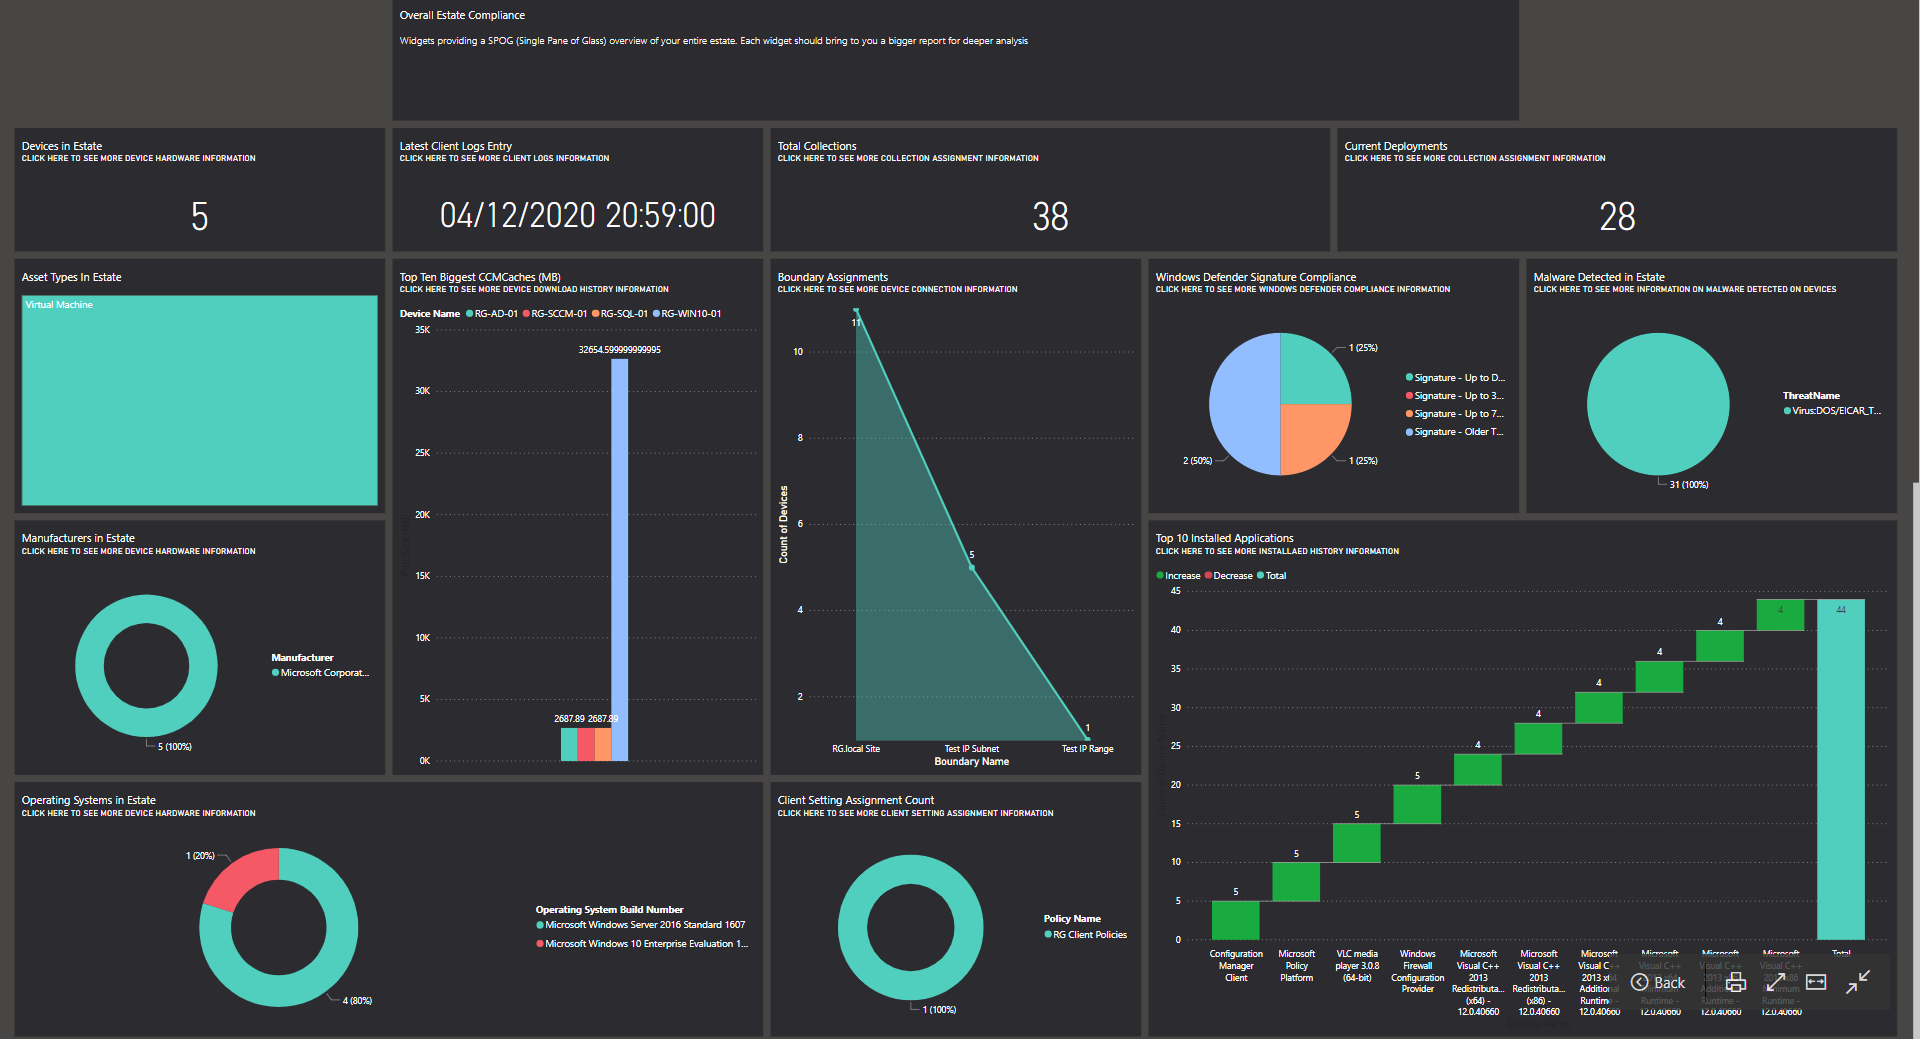
- Chassis Type in Estate
- This section will show exactly not only the count of the devices but more specific in terms of the chasis type which can range from Desktops, Laptops, Tablets, Mobile Devices, servers etc. We get alot of cases in which we want to know a specific broken down count on the types of devices we have within the estate so this provides a great summary
Click widget to go to the Device Hardware Explorer report - Manufacturers in Estate -
This widget will show all of the different flavours of machines which are currently within the estate to give an idea on perhaps different drivers that can effect each different manufacturer.
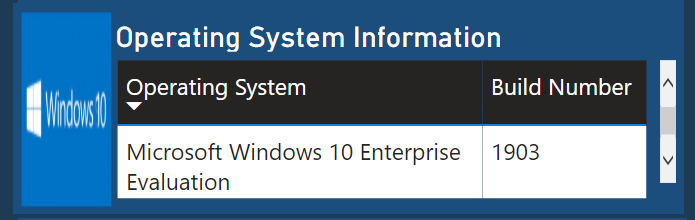
Click widget to go to the Device Hardware Explorer report - Operating Systems in Estate -
This widget shows all of the OS'es in your estate but it will also outline the build number as well so you can see the fuller complete drilldown on overall compliance of the different types of operating systems in your estate
Click widget to go to the Device Hardware Explorer report - Top Ten Biggest CCMCaches (MB) -
This widget will detail which of the top 10 machines within the estate have the largest CCMCache folders which will provide a great help in not only knowing how much space which the CCMCache can be impacted at but also see a download history of the machines in question once clicking the widget.
Click widget to go to the Device Download History - Current Deployments
- Simple tile to display how many current deployments are running within the estate in total.
Click widget to go to the Device Collection Assignment - Total Collections
-
Simple tile to display how many collections there are within the estate in total.
Click widget to go to the Device Collection Assignment - Latest Client Logs Entry -
Simple widget which shows the date of the latest client log entry to satisfy the administrator that client logs are indeed being synchronised.
Click widget to go to the Device Client Logs - Boundary Assignments -
This widget will show a great drill-down of how many machines are part of each boundary which tells us exactly how and where they will be receiving their policies and deployments from.
Click widget to go to the Device Connections - Client Settings Assignment -
This widget shows all of the custom client setting assignments which the total number of devices are applicable to.
Click widget to go to the Device Client Settings Assignment - Windows Defender Signature Compliance -
Pie chart widget which shows the signature compliance of how many have received updates for their anti malware today, within 3 days, 7 days and also older than 7 days.
Click widget to go to the Device Windows Defender Compliance - Top 10 Installed Applications -
This widget shows a chart displaying the count of the top 10 installed applications throughout the estate and its device count.
Click widget to go to the Device Software Explorer - Malware Detected
- This widget shows all of the different types of threats and viruses which have been detected within the estate.
Click widget to go to the Device Windows Defender Compliance
Device Hardware Explorer
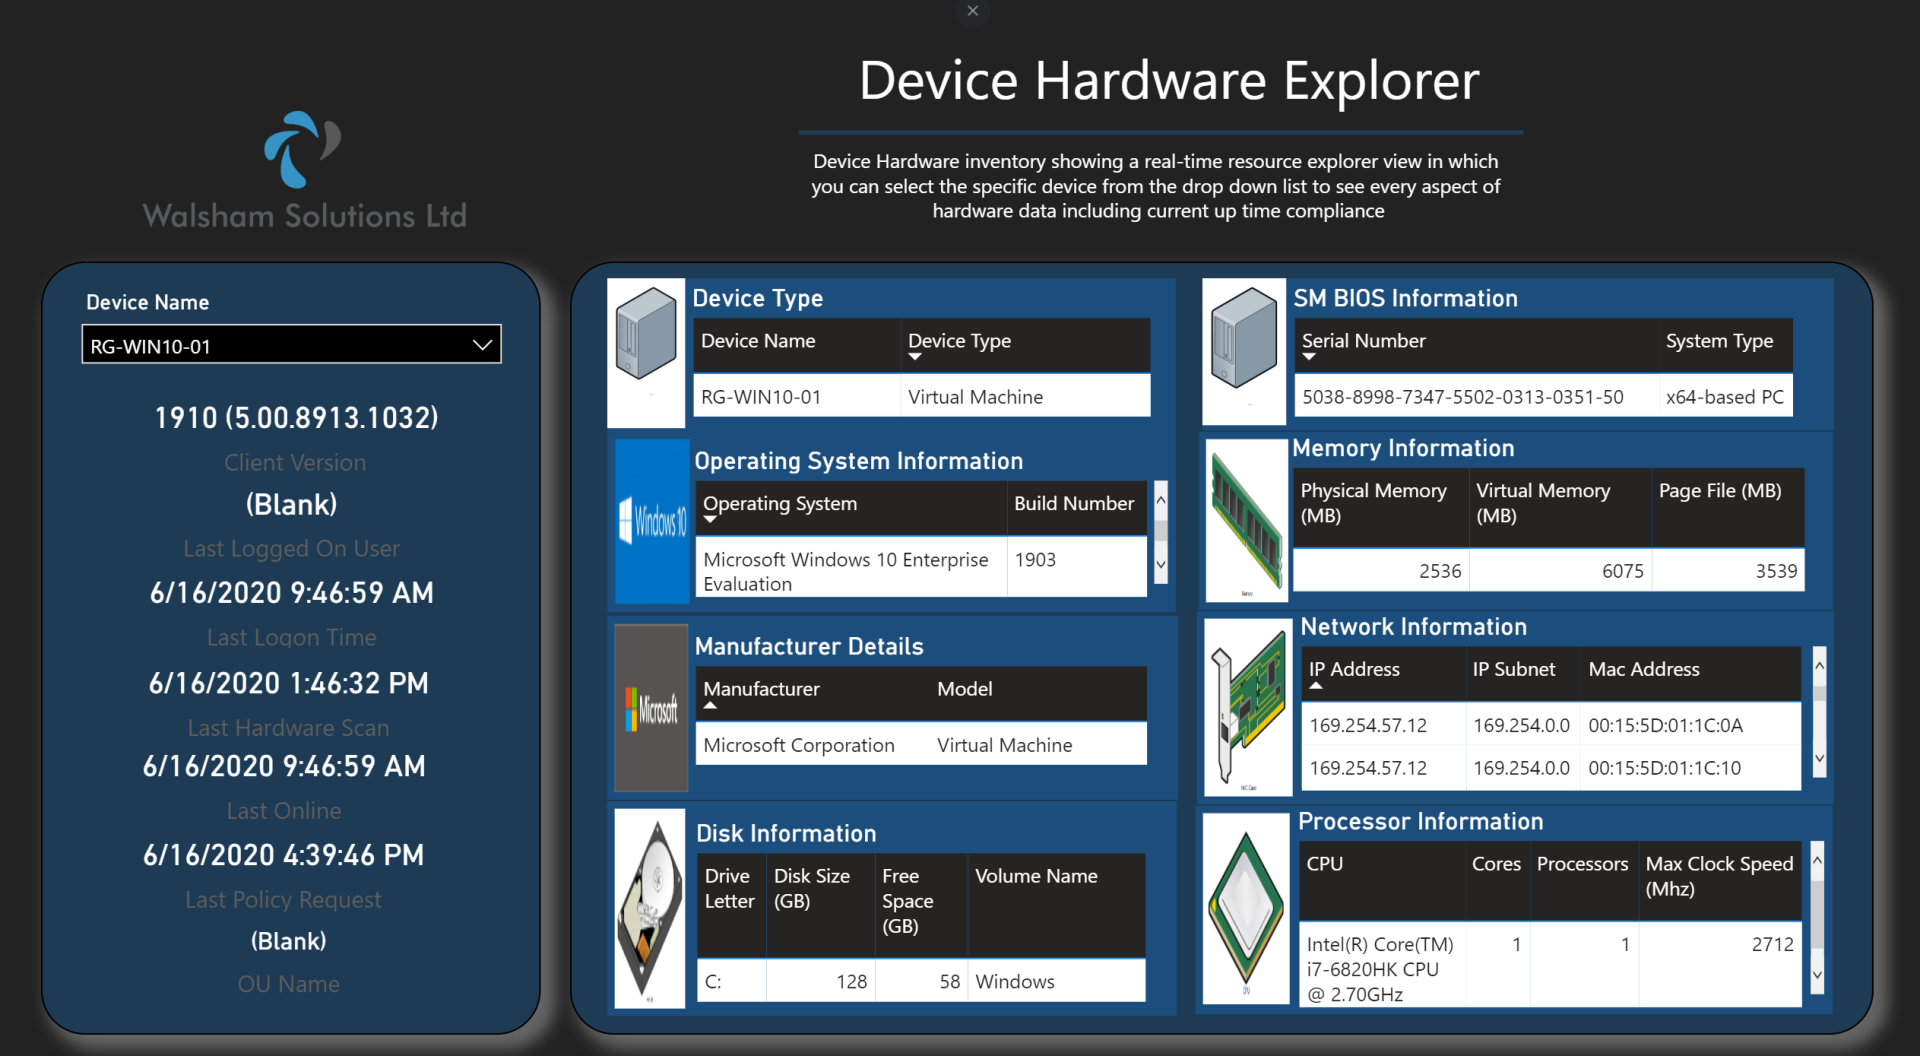
First up is the Device Hardware page which is a more refined visual of the resource explorer view which you would get within the Configuration Manager console when looking at specific devices.
On left hand side you can select specific devices and view all of the vital information in which will most likely be asked or requested by many which can now be displayed quickly and efficiently;
- Client Version
- Last Logged On User
- Last Logon Time
- Last Hardware Scan
- Last Online
- Last Policy Request
- OU Name
The other side of the report then shows all of the vital hardware information, which is grouped in sections which provide categorical detail such as;
- Device Type
- SM BIOS Information
- Operating System Information
- Memory Information
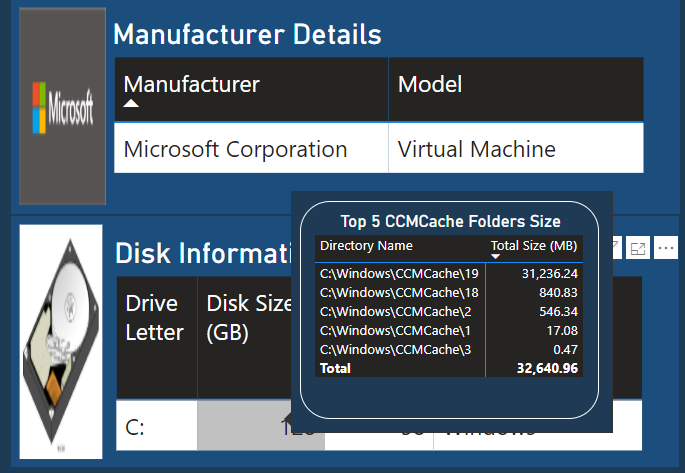
- Manufacturer Details
- Network Information
- Disk Information
- Processor Information
Also another feature added is a tooltip for the Disk Information table, which will pop up with a visual which illustrates a breakdown on all of the data downloaded from SCCM to the CCMCache folder, so you can get an idea as to where you stand with space being occupied
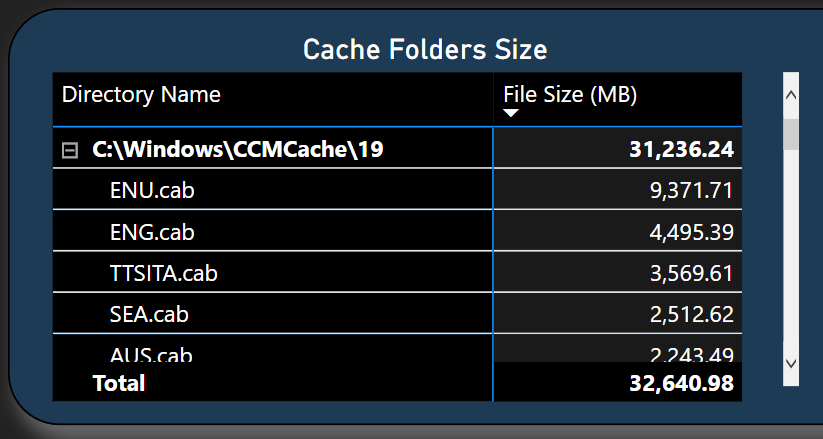
Device CCM Cache History
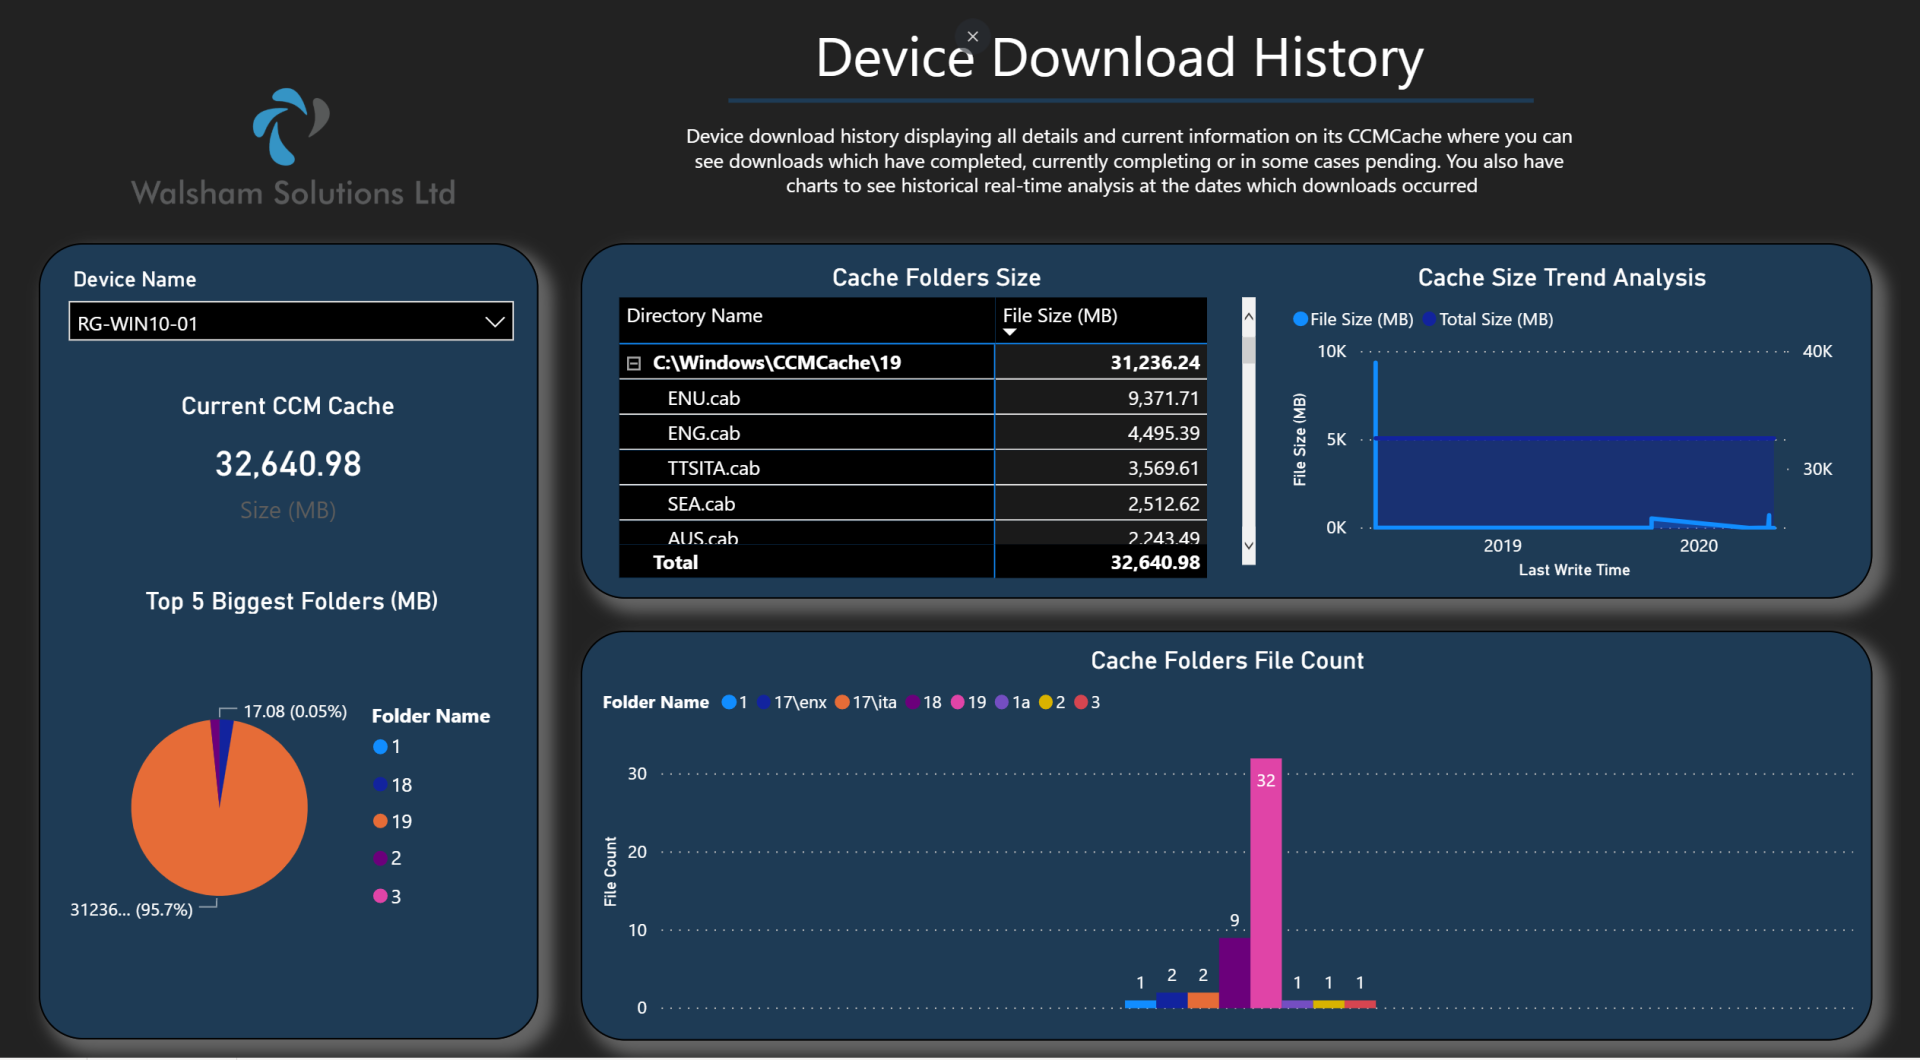
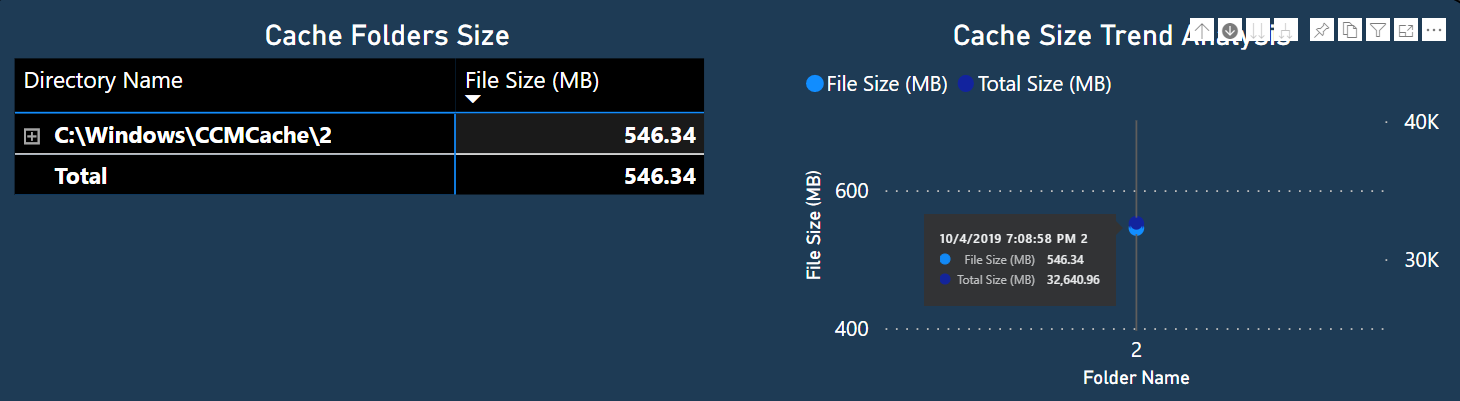
The download history page focuses on a intricate breakdown of everything downloading to the CCMCache folder. Here we can see the size of the CCM Cache currently and the top 5 biggest folders which are utilizing the most space.
The Cache Folder size matrix gives a great breakdown on each individual file which has been downloaded to that folder within your CCMCache folder as seen below.
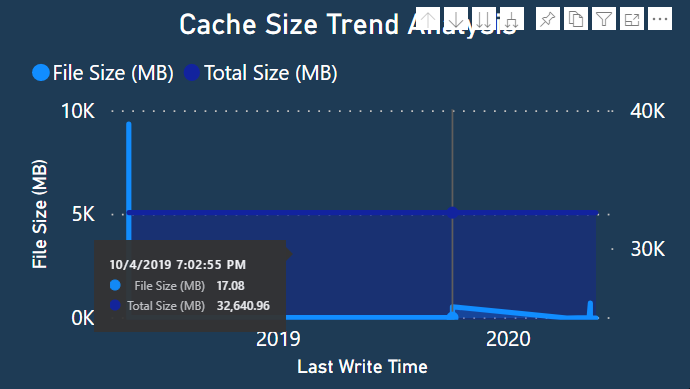
Also we have a real-time trend analysis which shows not only the total but a progressive total where we can see exactly when something was downloaded and how big it grew until it eventually gets the total size shown in the charts.
And below is a chart which shows a count of how many files are in each folder to give a better summary.
Device Collection Assignment
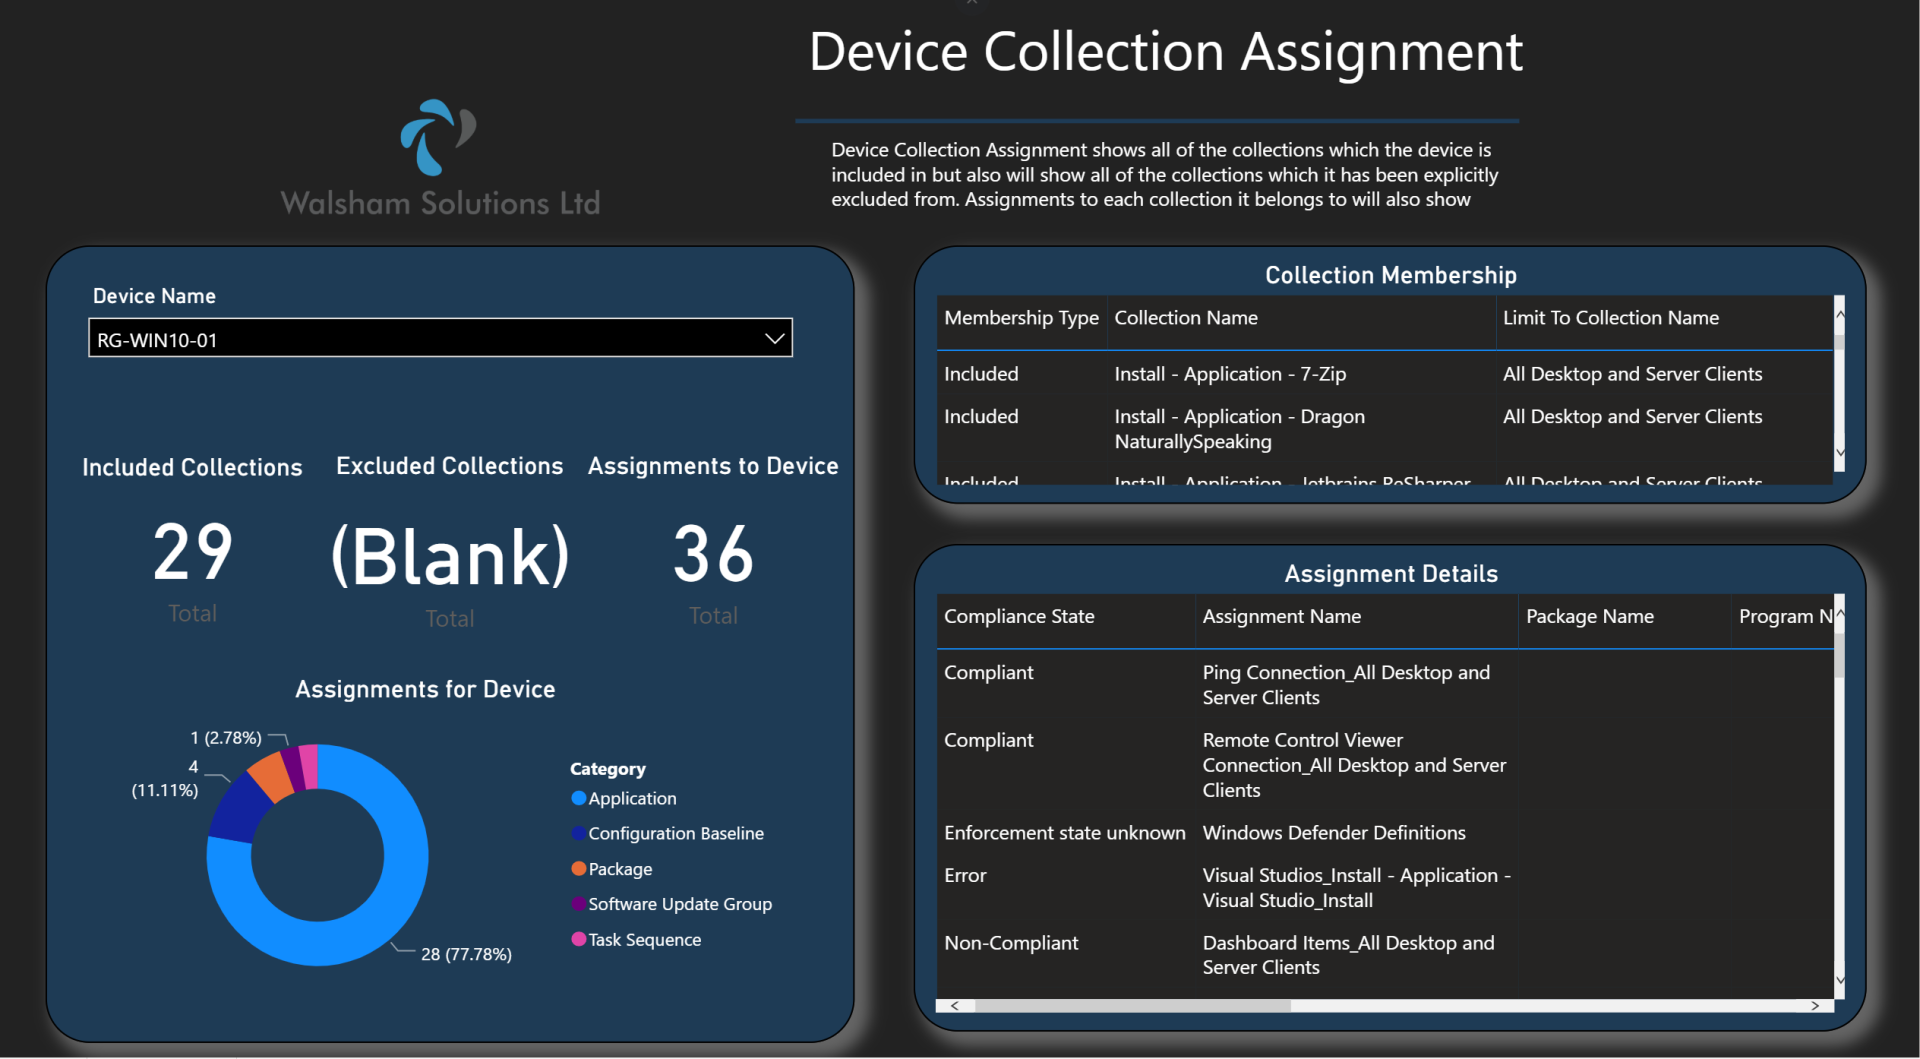
The Device Collection Assignment report allows you to investigate all of the collections in which an asset is a member of, a feature in which you are able to do in the MEMCM console now when selecting a device within the Devices view.
However, this page works to consolidate information a little step further with the following below;
- Excluded Membership - This report will show you all of the collections in which a device has been specifically excluded from, where certain collections have been excluded on some this will detail exactly which ones it cannot be a member of. Which will save a lot of time in trying to find as to why a device cannot be added into a specific collection
- All Assignments and Compliances -
Here you can see every single kind of assignment which the device is part of whether it be an Application, Package, Task Sequence, Configuration Baseline or Software Update Group deployment. Here you will not only see a very detailed list but you will see its current compliance state for every single one its a part of.
In addition you can also see a summarized breakdown on the left which gives an overall count of the type of assignments as well as how many collections i am and not a part of.
Device Client Logs History
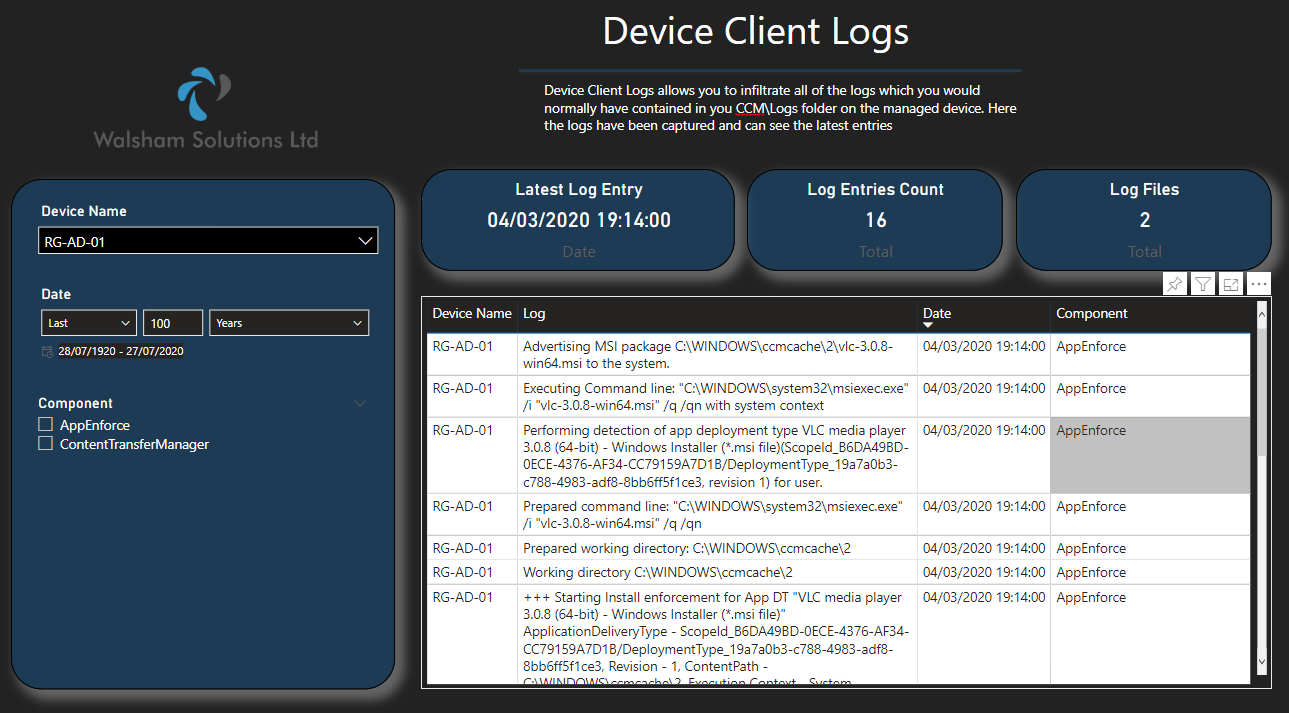
The Device Client Logs History report is a very different feature which amplifies the uniqueness of this dashboard. So this will detail all of the client logs latest entries which revolve around the latest 5 - 15 lines depending on the log in question which will be synchronized into a consolidated view in which you can select the following;
- Device Name
- Date Range
- Log File
This will allow the user to the latest entries which is perfect for knowing exactly which distribution points that your latest download was pulling from which compliments the Device Download History page where you can refer to and see exactly the dates as to when you received the package and where exactly from.
You will also be able to see the date of the latest log entry and how many entries are there in total for that device, and how many client log files are present to be viewed.
Device Connections
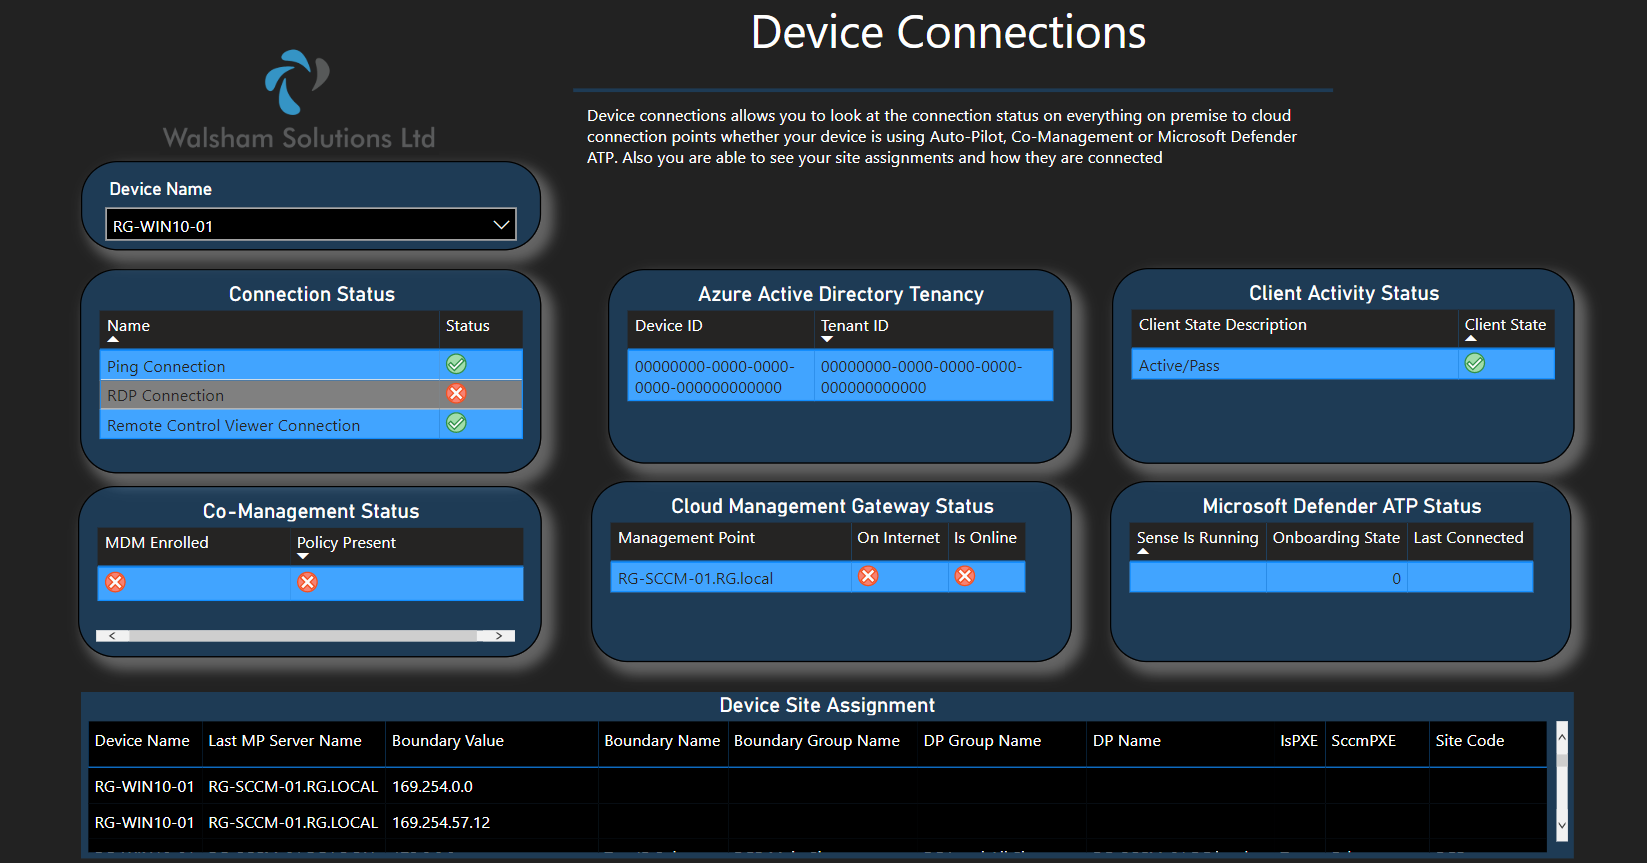
This report goes into great detail over every single type of connection in which a device has into SCCM or any type of remote management in general. Alot of us depend on the client recent activity timestamps, whilst they provide great information may not specifically state exactly whats wrong (or right) with the device.
So this report gives a great overview on uptime of each component.
For example we have the Connection Status
table which shows the following;
- Ping Connection - Can the machine be pinged currently
- RDP Conenction - Can the machine receive a successful RDP connection
- Remote Control Viewer Connection - Can the machine be controlled using Remote Control Viewer
Not only that but this has been expanded to cover all of its cloud connection points to see exactly where this device is being managed by.
So tables such as;
- Azure Active Directory Tenancy
- Co-Management Status
- Cloud Management Gateway Status
- Microsoft Defender ATP Status
The last section is then the Device Site Assignment table. This is very important as a lot of us want to know how does the device connect through into SCCM by which boundary. And boundary issues are extremely common to a lot of issues receiving any kind of deployment from being in the wrong boundary or not in one at all.
So here we can see which boundary its assigned to, including the correct distribution points and management point. And from here we can gauge a completely deeper understanding on the devices whereabouts in the network. The great part about this section is that it applies for all of the boundary types (except IPV6 sadly :) )
Device Client Settings Assignment
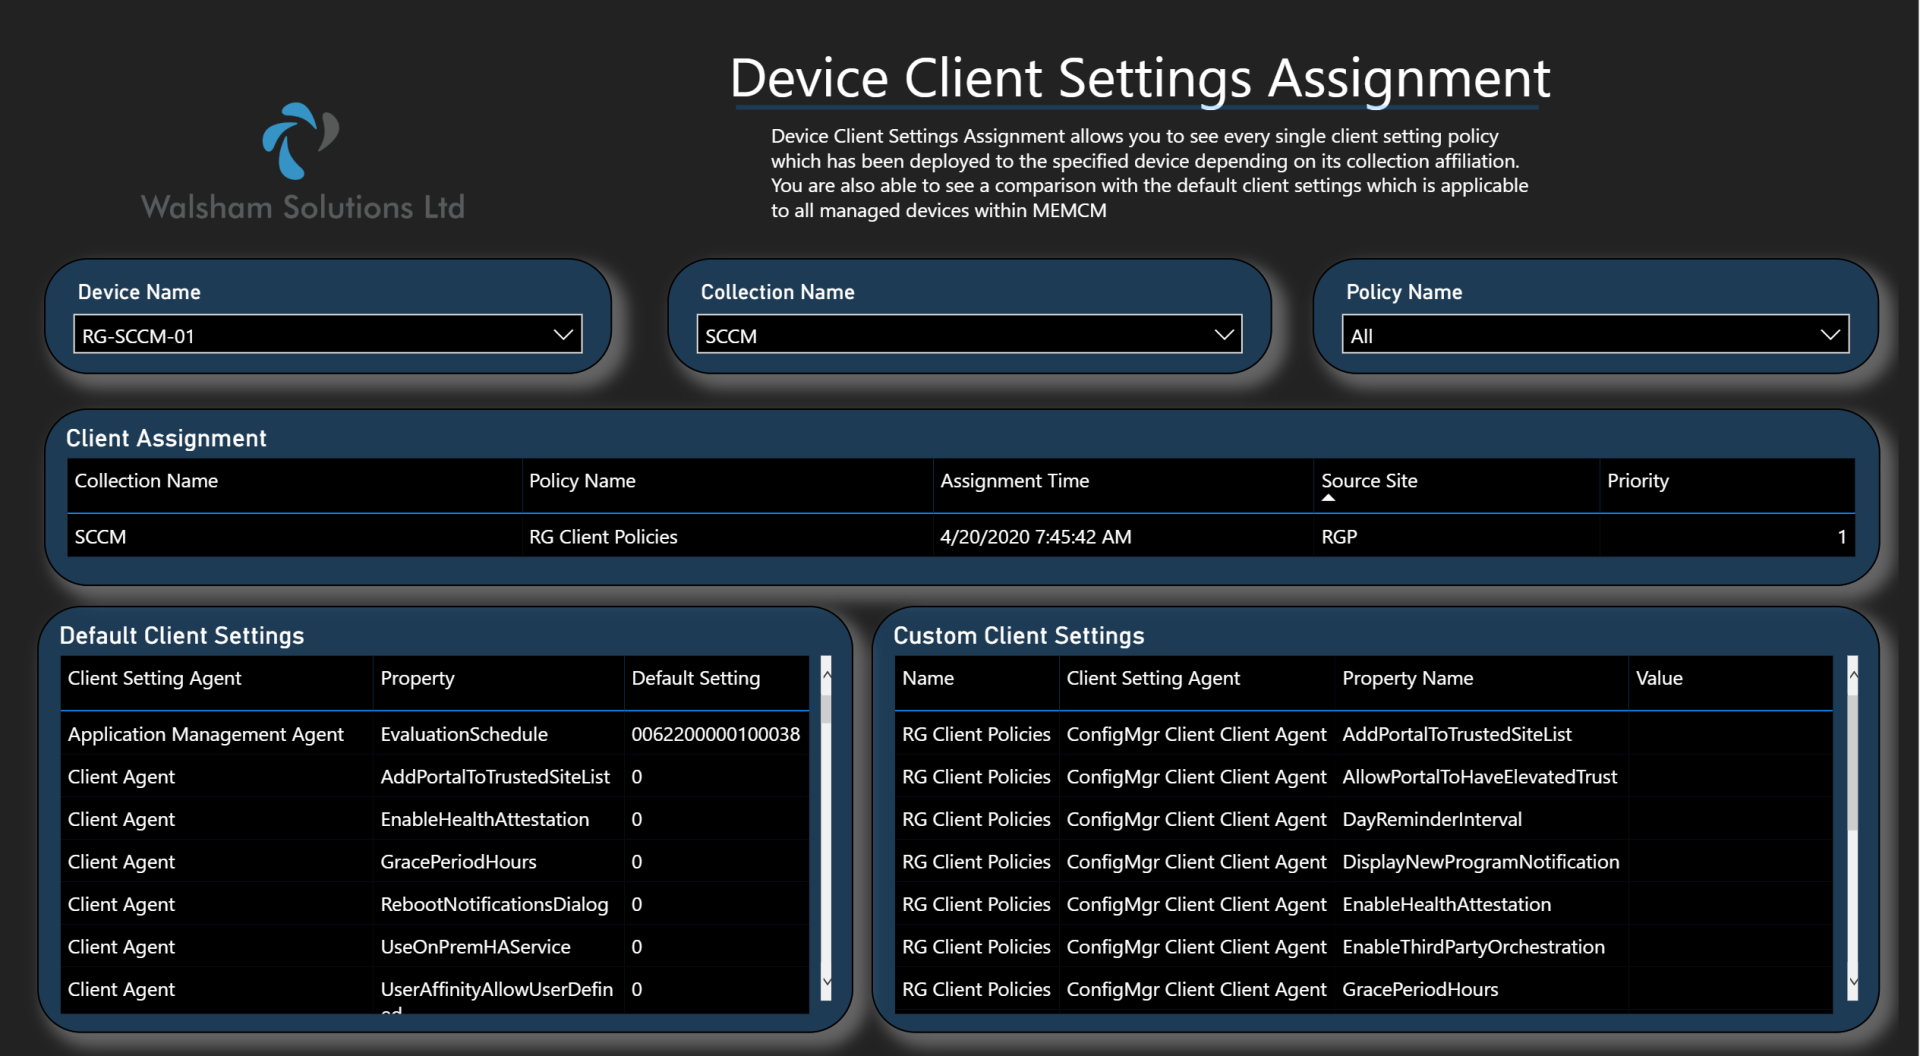
The Device Client Settings Assignment report shows all of the custom client settings in which a device is a part of. This time this has been leveraged to SPOG (Single Pane of Glass) view so that now you can see every single setting which is applicable in that custom client setting.
And also to take it a step further, we have also included the ability to look at the default client settings which are applicable to every single device in SCCM so you can see all of those settings and also draw a comparison to both.
Device Software Explorer
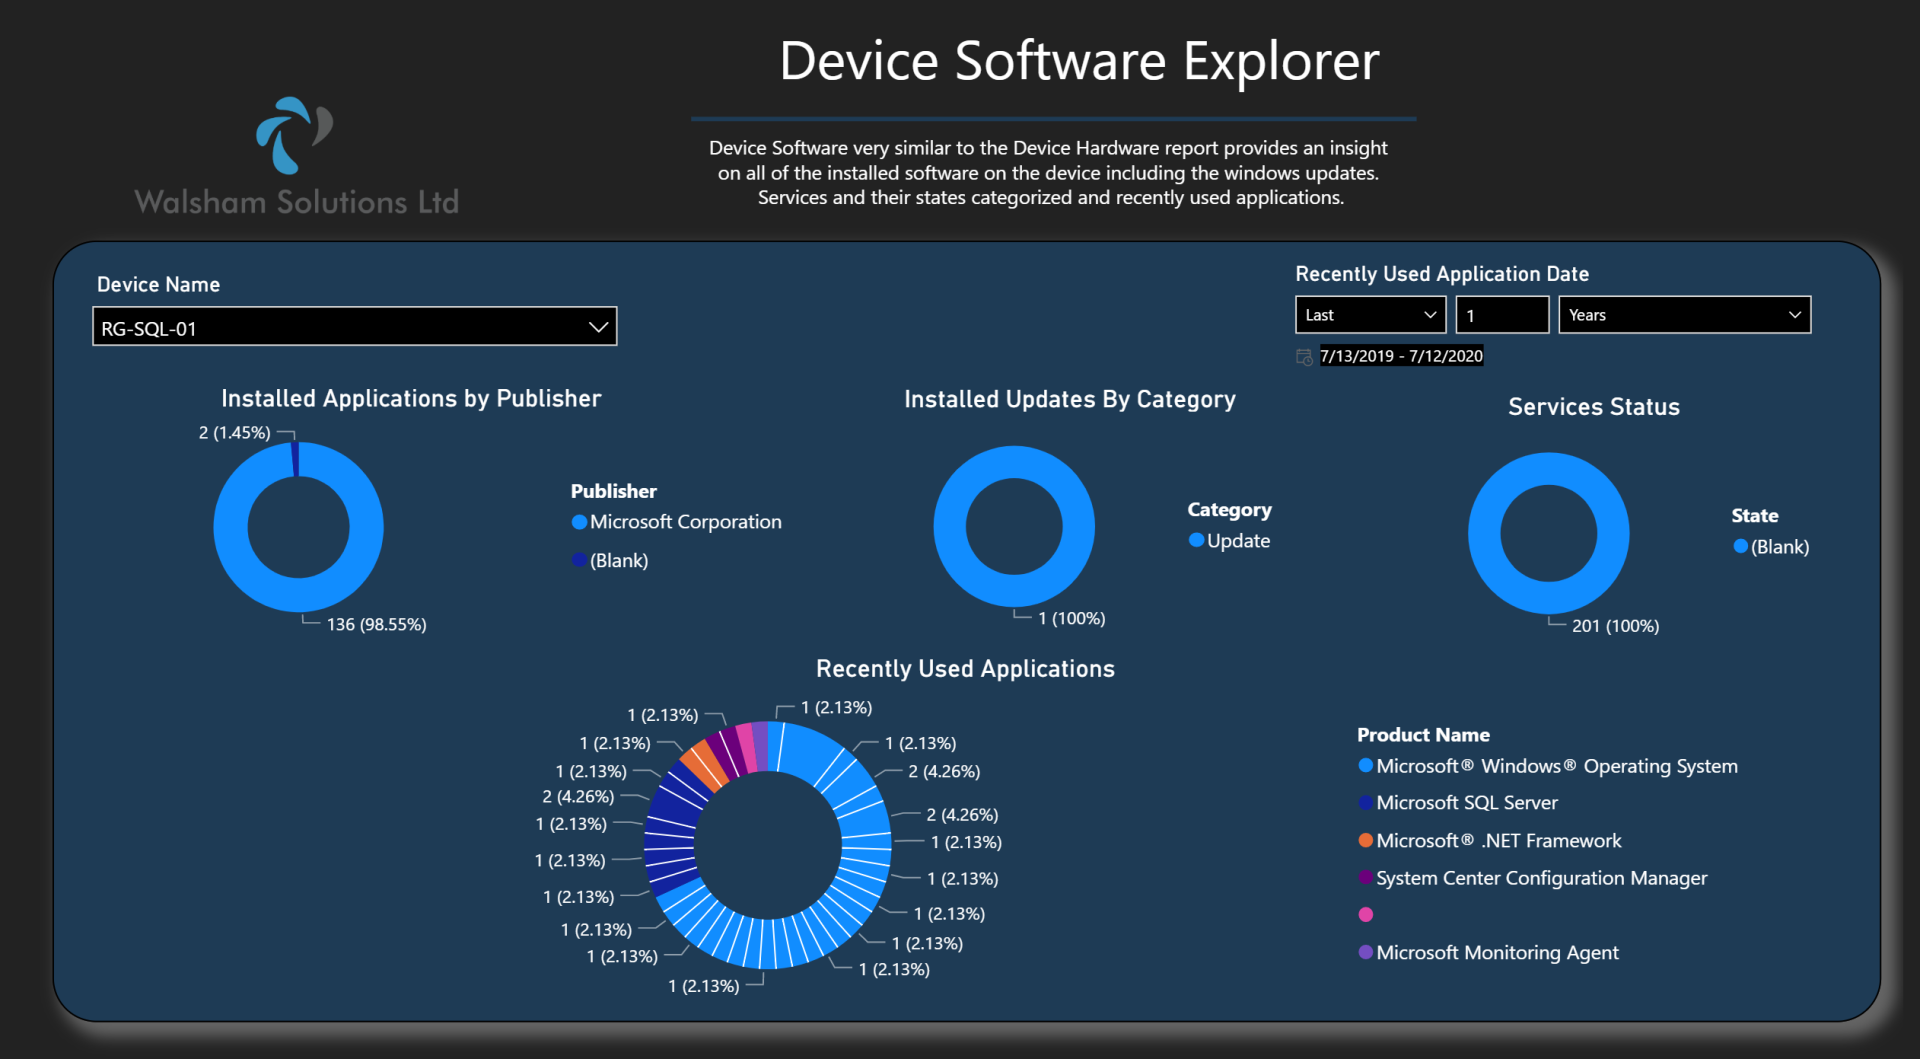
The Device Installed History is a further extension to the overall resource explorer, in this case it focuses more on the software side by providing a deeper look into the following;
- Installed Applications
- Installed Updates
- Recently Used Applications
- Services Status
Most frequently used applications is also a great way to gauge exactly what a device is currently being used for, and also to compliment is the Services Status which shows all of the status of each service for which ones are started or stopped abruptly.
Device Windows Defender Compliance
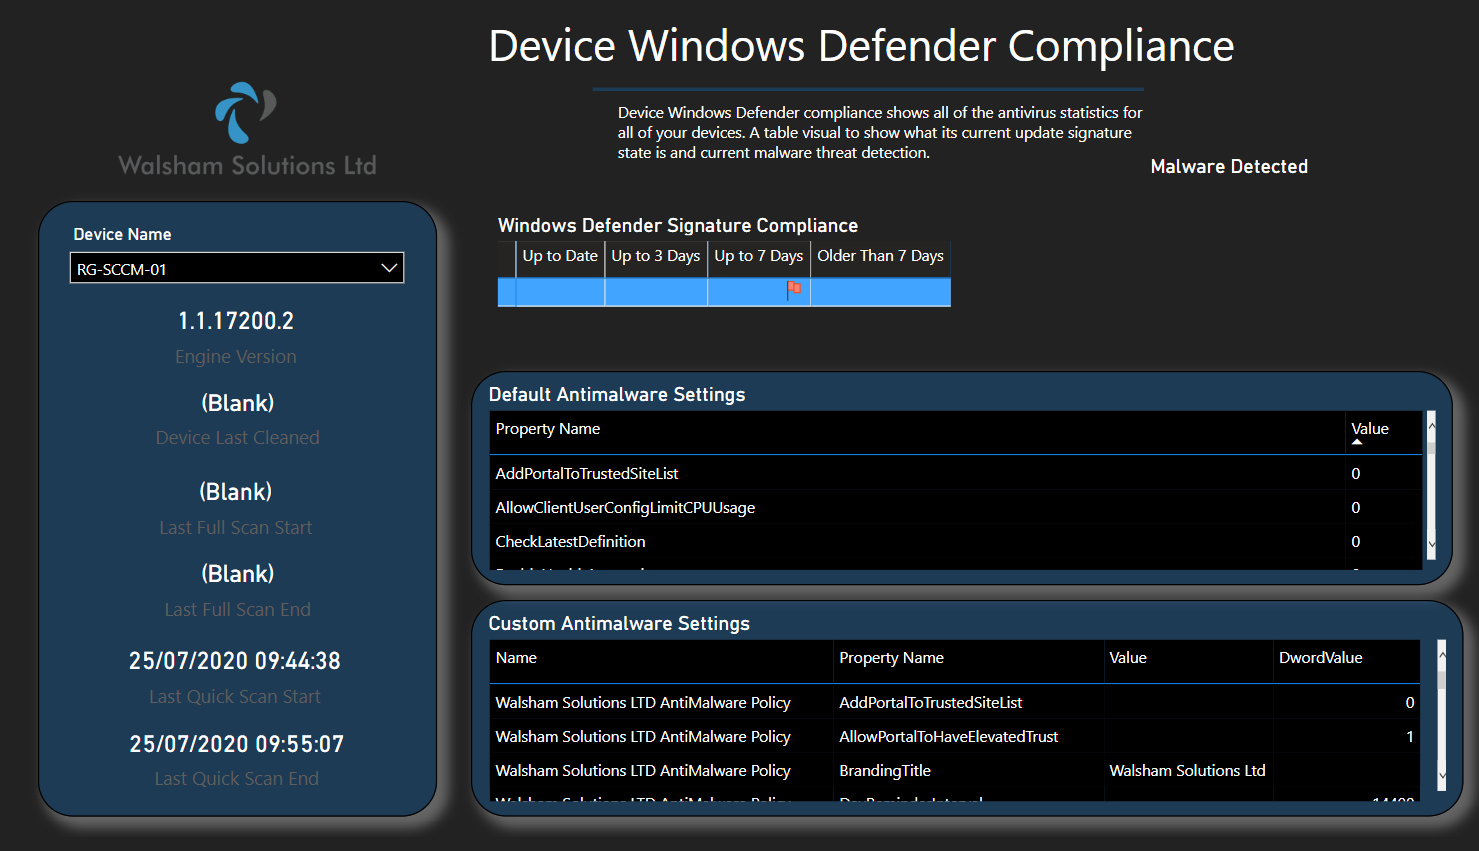
The Device Windows Defender Compliance is a deep analysis of all areas when it comes to anti malware.
We recognise that many organisations may still be utilising Windows 8 or Windows 8.1 which would inform us that they are still using Endpoint Protection as opposed to Windows 10 being mainly Windows Defender, so all aspects are indeed covered here.
Firstly we look at the compliance around scans, but also specifically as to whether this device has obtained the latest updates for its Anti Virus signature, where there are a lot of target driven results to hit to achieve full health compliance across your estate.
But not only that another part is the health of the device when it comes to Malware and virus detection. Here we have widgets which detail what the device has and if all is healthy.
And to top it off we also have the custom settings for any EP policy in which the device is applicable to.
Antimalware Settings
This page contains the default antimalware policy which applies to every single machine by default, course depending on the priorities which you have setup this can be a different case. Which is why this page contains a table which shows all of the custom antimwalre settings which this device is also applicable to
Windows Defender Signatures
A matrix table configured with conditional formatting which displays exactly which signature category compliance it currently falls under. The flag will simply change to a different section if its status has changed at anytime.