
Power BI - System Centre Dashboard Best Practices
Best way to transform your System Centre Data Efficiently

Purpose of this Article
Over the years you have seen Walsham Solutions create various dashboards and reports from using Power BI, transitioning from the traditional .RDL Report Builder (Paginated Reports) which have provided even more enhanced and advanced detail to our statistics and provide great ways of performing health checks.
We normally see Power BI & BI Intelligence evolve around financial statistics and crunching big data in this way, but wanted to bring the focus on the optimisation of a similar standpoint to our System Centre toolsets such as the ones mentioned below;
- MEMCM (Microsoft Endpoint Manager Configuration Manager)
- SCOM (System Centre Operations Manager)
- SCSM (System Centre Service Manager)
- SCVMM (System Centre Virtual Machine Manager)
- SCDPM (System Centre Data Protection Manager)
- SCORCH (System Centre Orchestrator)
These also provide very important statistics for us, especially when it comes to vast areas such as deployments, monitoring, virtual estate and backup information, the same can be done for our tool sets.
However the fundamental differences is that these tool sets normally have a Data Warehouse with very specific data retention settings which can store data for how long we choose to configure, and miss-configured or non configured data retention on a Data Warehouse as well as an operational database can cause data source access and data transformations to be incredibly slow. This has a knock on effect for whenever we try to refresh data in anyway possible, which then has a negative impact on our database infrastructure as well as resources.
So this article is to illustrate a guide of best practices and what I would recommend to use and the reasons to backup each recommendation
Spring Clean your System Centre Tools
This is the most important prerequisite for preparation before developing any reports or dashboards.
Old or orphaned data clogging up your databases have a huge effect on how you can transform your data. Below is a section for each System Centre tool to give an idea on what to do to keep old data out of scope.
MEMCM/SCCM
- Your site maintenance tasks can clear a lot of your old data within your environment. Some are enabled by default whilst others may require a little bit more tuning. A full comprehensive list can be found here https://docs.microsoft.com/en-us/mem/configmgr/core/servers/manage/maintenance-tasks
- Another part of the cleanup which you can run would consist of the age of old deployments which you have in your environment consisting of software update patching schedules and package deployments.
- Also to note that collections with huge member counts can also play a huge factor especially if wanting to build something that has deep analysis into every device in each collection for example sake. There is also a best practice that exists which talks of not using "All Systems" collections as its main limiting collection to avoid adding any machine, but there is also another reason for why you shouldn't. Any time in which you refresh the All Systems collection or does this by default around 4:00 am, every collection that uses this as its limiting collection will also update and if you have member counts of over 10,000 or more this can lock tables for a while thus hindering your refreshes of reports.
- A Data Warehouse point role could be great in the future if wanting to transfer historical data across if you still require it, but there are also alternative methods.
SCOM
Data retention for SCOM is extremely important for both the operational database and also its Data Warehouse.
- Tools such as the DWDATARP are great to set the data retention settings for your Data Warehouse so certain datasets don't get too big and can be cleared regularly https://techcommunity.microsoft.com/t5/system-center-blog/data-warehouse-data-retention-policy-dwdatarp-exe/ba-p/340415
- Database grooming settings on the administration tab in your SCOM console should also be set and configured appropriately to ensure that you don't keep more data than you need.
- Any management packs which are causing too much noise (configuration churn) should either be removed or properly tuned beforehand
SCSM
SCSM uses a multitude of databases which make up the entire Data Warehouse which consist of several areas of staging data which is organised from the data warehouse jobs.
- Ensure any management packs specifically imported from a SCOM perspective are only ones of which you need as the connectors for alerting can have a tendency to migrate a possible configuration churn into your service requests model. In addition where inventory is concerned for your SCOM CI Data connector ensure you are on top of any orphaned objects which are brought across from this connector.
- Similar to the SCOM CI data connector, others such as Active Directory and other System Centre tools such as SCCM also have their own cleanup methods which should ideally be adhered to ensure a clean topology all round.
SCORCH

- Orphaned runbooks and logs can cause huge impacts on the Orchestrator Database. Clearing of the authorization cache on a generic workaround wont always work you will need to ensure your log clearance settings are also configured correctly.
- Ensuring you don't have an overloaded amount of runbooks creating too many runbook jobs which may not be needed.
- Any enhanced logging which consists of logging every single step of a runbook could cause tables to be extremely big, so handle this with care if looking to bring this into a data model on your report/dashboard.
Pre Data Transformation
Selecting the correct Data Source Connection Type
DirectQuery Not Recommended
Apologies if this section re-iterates what you may already know about certain connection types. This is only to give a breakdown as to the reasoning of the recommended type to select.
But for those who may not be aware there are a couple of data connectivity modes to be aware of when creating a data source to your SQL Databases when creating any reports or dashboards.
For those who have created a report using SQL report Builder (Power BI report builder now for paginated reports) will remember its layout as where it will show all of the visuals and tables which you used to create the report, and nothing would show until you actually ran the report at that specific moment where the data is ran in memory? In Power BI this is similar to the DirectQuery
data connectivity mode.
Utilising this would give you a similar option, however the difference is that the latest data would be shown all of the time which is a great feature, but there are various limitations which may prevent you from using this particular connectivity mode below;
- A one million row limit - We know as System Centre admins even with the proper maintenance this is not realistic in a real life scenario to maintain with. If we take tools such as SCCM where one would have various deployments over a span of several months, tables such as VSMS_ClassicAssetDeploymentDetails alone would rip right through this and the downside would be that key information would be missed.
- Only one Data Source can be used - Another hurdle here. If we take for example tools such as SCOM and SCSM, where they use a Data Warehouse or in fact multiple data warehouses in SCSM's case. We would be unable to manipulate data which would mix between multiple DB's to create a complete picture for our Dashboards
- Time & Date Capabilities not available - This prevents us from looking at our data on a historical perspective, which is very key when it comes to root cause analysis or stats which we would need to find out spanning over certain periods of time.
- Single Direction Relationships - Not that I can categorize these points as to which is the most impactful to providing our targeted results, but this potentially could be the biggest killer. We will go into this one in more depth but this feature stops you from having certain datasets having a relationship which allows you to filter between results, look at it similar to a SQL JOIN function.
Import is the Best Option
The standard importing of data into the report/dashboard is more beneficial for us as it's a lot quicker than the DirectQuery mode but also there is another point which would benefit System Centre Admins.
When it comes to these tools there are a lot of refresh and synchronization points which have to take place before the data in the database is refreshed and then shown within the respective GUI consoles after. Where the import data connectivity mode is helpful is that depending on the last time we refreshed, we can see all the data refreshed from the last time we performed it so we can still observe the last synced point of our SPOG (single pane of glass) data.
Also without the limitations of the above this provides a better standpoint for an administrator.
Do Not Over complicate Queries
Over complicated SQL queries can really play an ever bigger part in affecting the performance of not only your dashboard but easily eat up all of the resources within your SQL Servers.
I have learned that certain lines or conditions in which you add to your queries can cause your SQL TempDB to rapidly increase and fill the designated drive up until you receive errors of timeouts and out of space errors.
Below are some of the conditions where if you can avoid them at all costs especially if they are tables, views, functions or stored procedures which have a great amount of data in them;
- Distinct
- Where (Basic conditions are fine multiples which require bracketed lines will cause issues)
- Order By
- Group By
With the transformation of your data where possible is to let all the data unfiltered come through from the data source so that we can utilize the Power Query and M language to filter the same way as we would have done when compiling a more detailed query, which is the true power that we have using Power BI.
How to overcome huge historical tables
In situations where you use a tool such as SCCM where you have historical deployments across a multitude of collections with huge member counts, there maybe times where this is needed and simply removing them or cleaning them up is simply not possible.
There is a workaround for this. These tables and these queries can consist of hundreds of millions or potentially billions of rows, and there may not be a justification to drill down into data that would be too old so we ideally want to keep the information in the report/dashboard somewhat current.
The best workaround in this situation is to add a WHERE condition which adds a date range which should substantially reduce the amount of rows that you will be bringing into your dataset.
Using SCCM for example if i have package deployments which go back as far as 2017, what i may suggest is to add a line such as
WHERE vsms_ClassicDeploymentStatus.DeploymentTime >= dateadd(day,datediff(day,0,getdate())-365,0)
The key line is the DateAdd
condition which allows us to cap the date range of data we want to bring into the data source. In a more ideal world if the tables or queries didn't contain too many rows we would have used the Power Query language to add this range, but if we are having issues in which timeouts occur this is potentially the best way to have your interpretation of only current data in your data set.
For any data which you wish to view older than this could potentially be used with the default paginated reports in your respective toolset.
Here is a reference for more on the DateAdd condition https://www.w3schools.com/sql/func_sqlserver_dateadd.asp
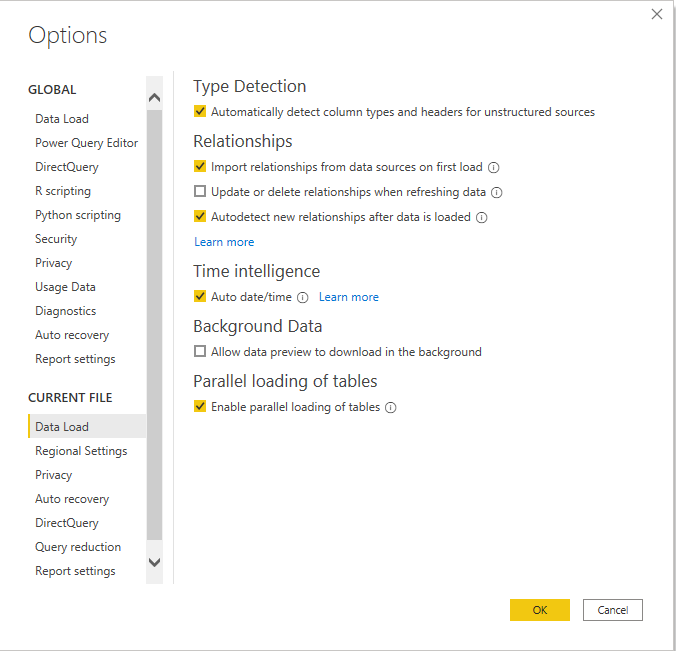
Turn off Background Data Loading
This is widely covered but has to be re-emphasized that this should be turned off.
The Background data option is when you have data previews which are loaded in your queries, these happen in the background by default whenever you import new data. If you have datasets which are very big not only can the preview refresh halt the amount of time it takes for your refreshes to change status from evaluating to loading data, but your TempDB will also go through the roof once again.
To change this perform the following on your report/dashboard using Power BI Desktop;
1. Go to File - Options and Settings - Options
2. Go to Current File - Data Load.
3. Click the tick box under Background Data - Allow data preview to download in the background.
4. Click OK
Post Data Transformation
Below are sections of what to do with the data which you have now imported into your report/dashboard within Power BI. Depending on the size and the age of your data will determine which of the following sections would be applicable to you.
Relationships, Appending & Merging Scenarios
When it comes to filtering and consolidating your data together then these types of sections are very important especially for System Centre Data.
I will provide some examples from of the dashboard which I have created which utilise these methonds.
Relationships
So lets start with relationships. For those who are familiar with SQL conditions such as "JOIN", "INNER JOIN", "LEFT OUTER JOIN" then you will be quite familiar to how the structure works for Relationships. Matter of fact it applies quite well to Append Query and Merge Query as well but we will go through the differences.
Now with Relationships these determine how data is cross-filtered between two datasets and are joined together by a column from each dataset which has a common value.
Below is a screenshot of a relationship which I have.
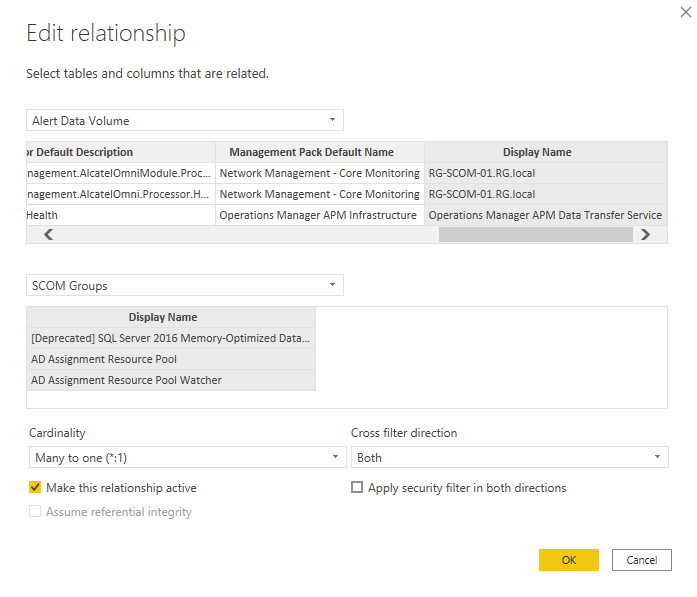
So where the cardinality is concerned i tend to use Many to One
which is really mapping values in one dataset that have the same value multiple times to another dataset which only contains unique values.
For the cross filter direction i normally use both
as where using visuals such as dropdown lists and combined visuals it allows me to cross filter between both.
One of the recommendations i would point out is to make sure you create a dataset specifically for any reference objects such as;
- Devices
- Groups
- Collections
So for example in this SCOM screenshot above, i made a dataset called "SCOM Groups" which only contains the SCOM groups as unique values. In this case you do have permission to use "distinct" if needed as these tables aren't very big .
Append Queries
Appending queries is the equivalent to a concatenate condition, by merging the tables together for which have the same column names as each other.
This function is quite handy especially when wanting to breakup datasets which can be substantially large, and to avoid additional resource impact on the database which you are extracting from and to just focus on the data transformation with Power BI is more beneficial.
Here is an example of appended query.
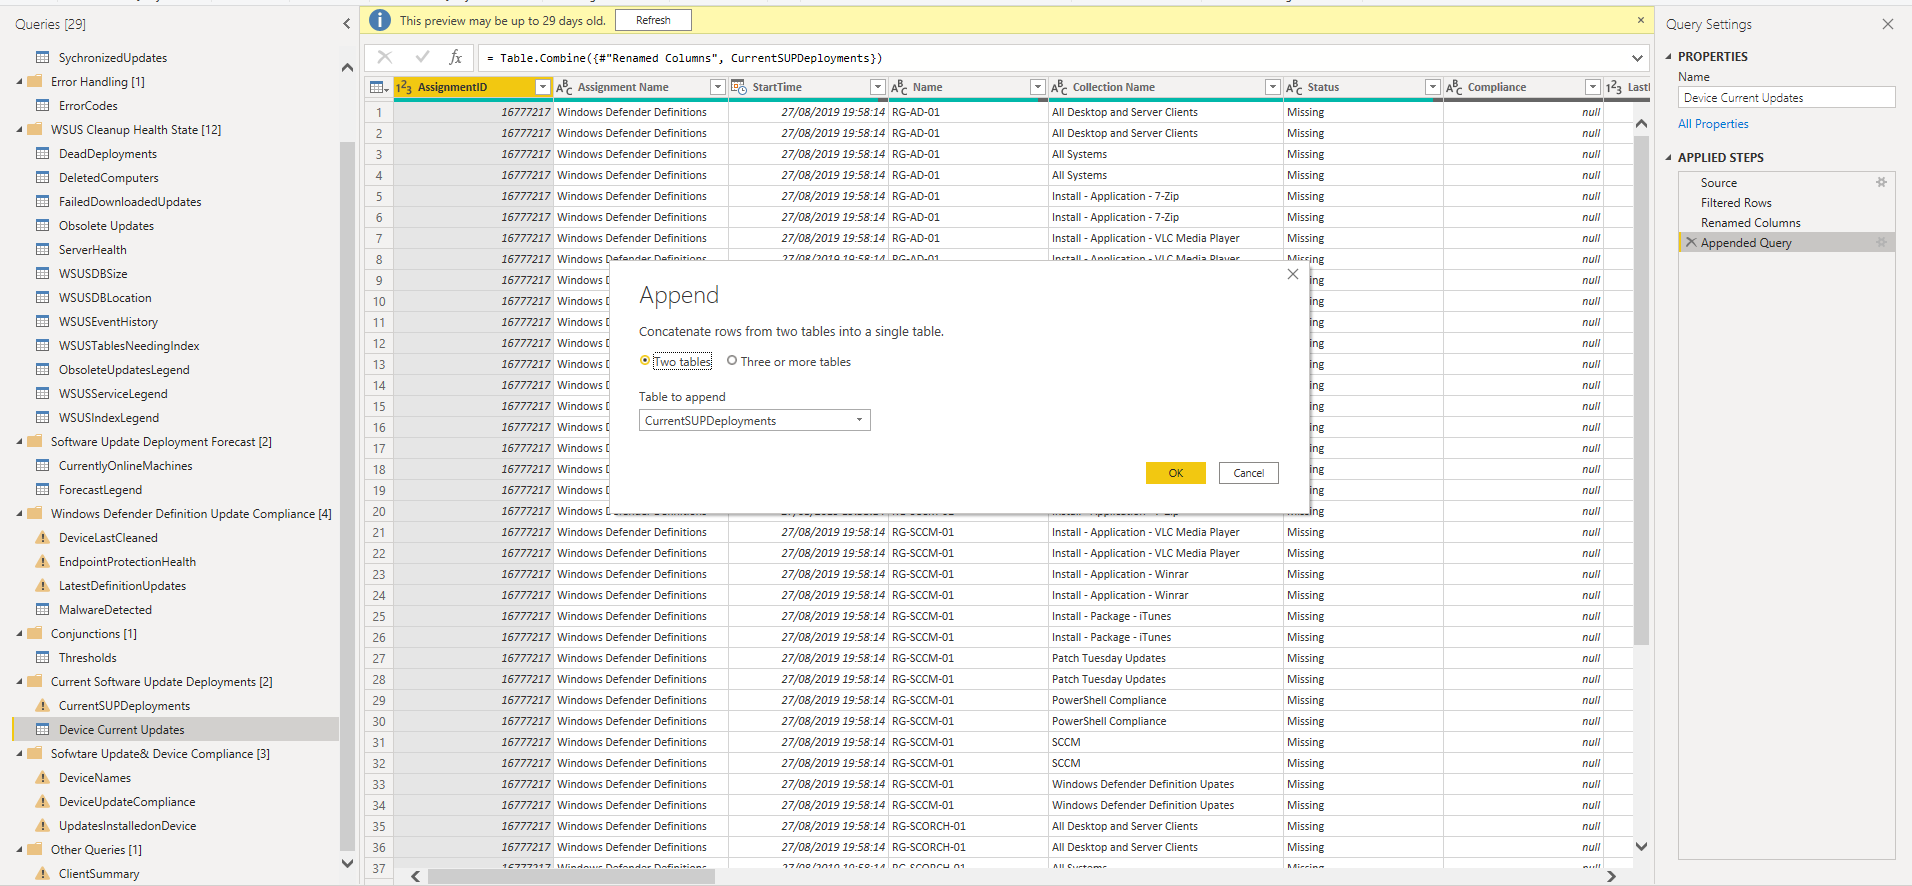
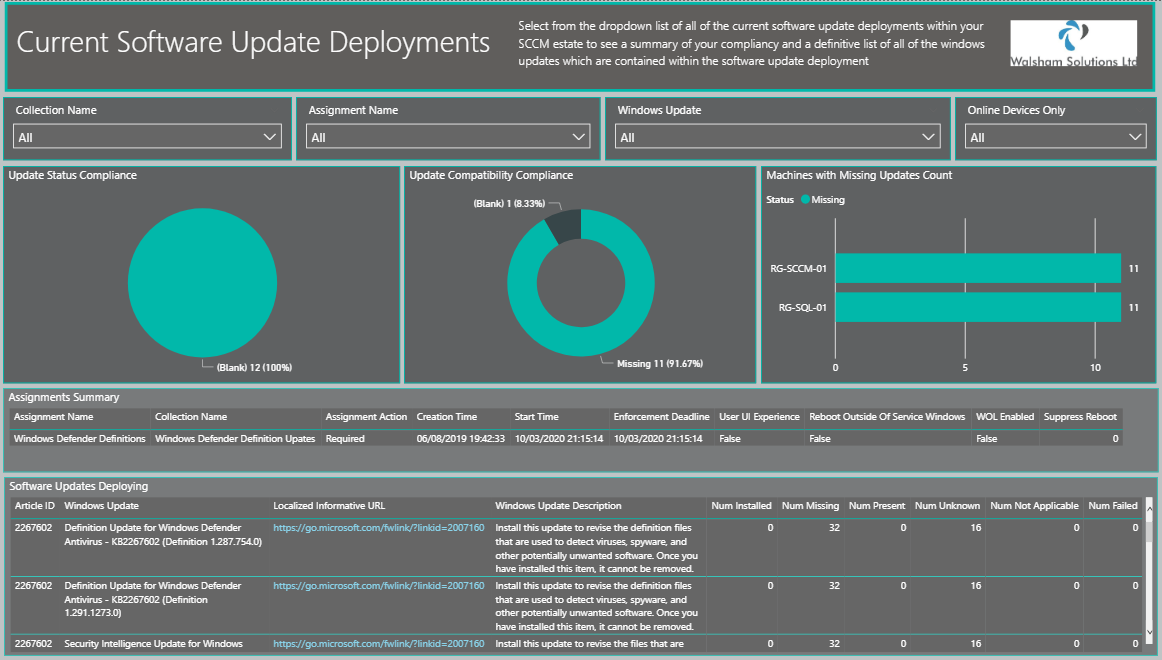
In this example this is to append a dataset which contains each device in each collection and the software update deplolyments applicable to each device and its collection membership. As these columns are the same they can be appended/concatenated together to show an overall bigger picture of the compliance. Forming this as one dataset caused almost hundreds of millions in rows, so in this example an append query was best and provides the output below.
Please handle this with care, as this can seriously increase the amount of rows your refresh will have to deal with when it comes to your dataset, so i would suggest you only use this method only when you don't have a great deal of historical data to run through.
Merge Queries
Now merge queries is basically merging everything together. This is the equivalent to a "LEFT OUTER JOIN" condition.
Same concerns apply where it can seriously increase the amount of rows processed. However in this case you are able to utilise better conditioning for columns you want to create the relationships between. So you can look at it as a more advanced version of a relationship.
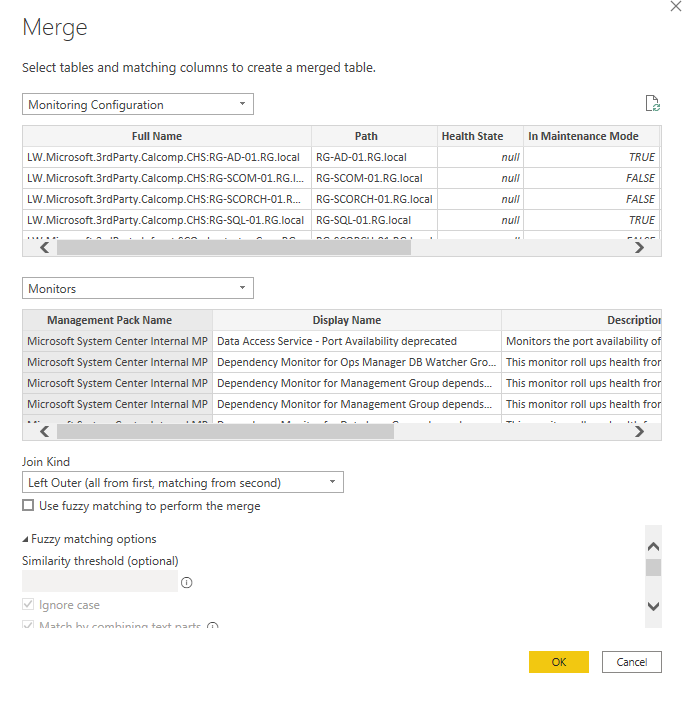
For this particular example this is for SCOM, where it merges a dataset which contains all of the monitoring class instances of each managed device within SCOM, to all of the applicable SCOM monitors which apply to every single monitor and specified management pack. As its a merged function all columns will be joined up and show as "blank" where not appropriate as its using a "Left Outer" join kind.
Formulating a dataset for all monitoring class instances and each device its applicable to and each monitor and management pack would cause a very huge dataset, so this is a great way of overcoming this.
Grouping
Grouping is also another way of filtering your data down even more, and again is quite similar to the Report Builder when creating a table within the table wizard.
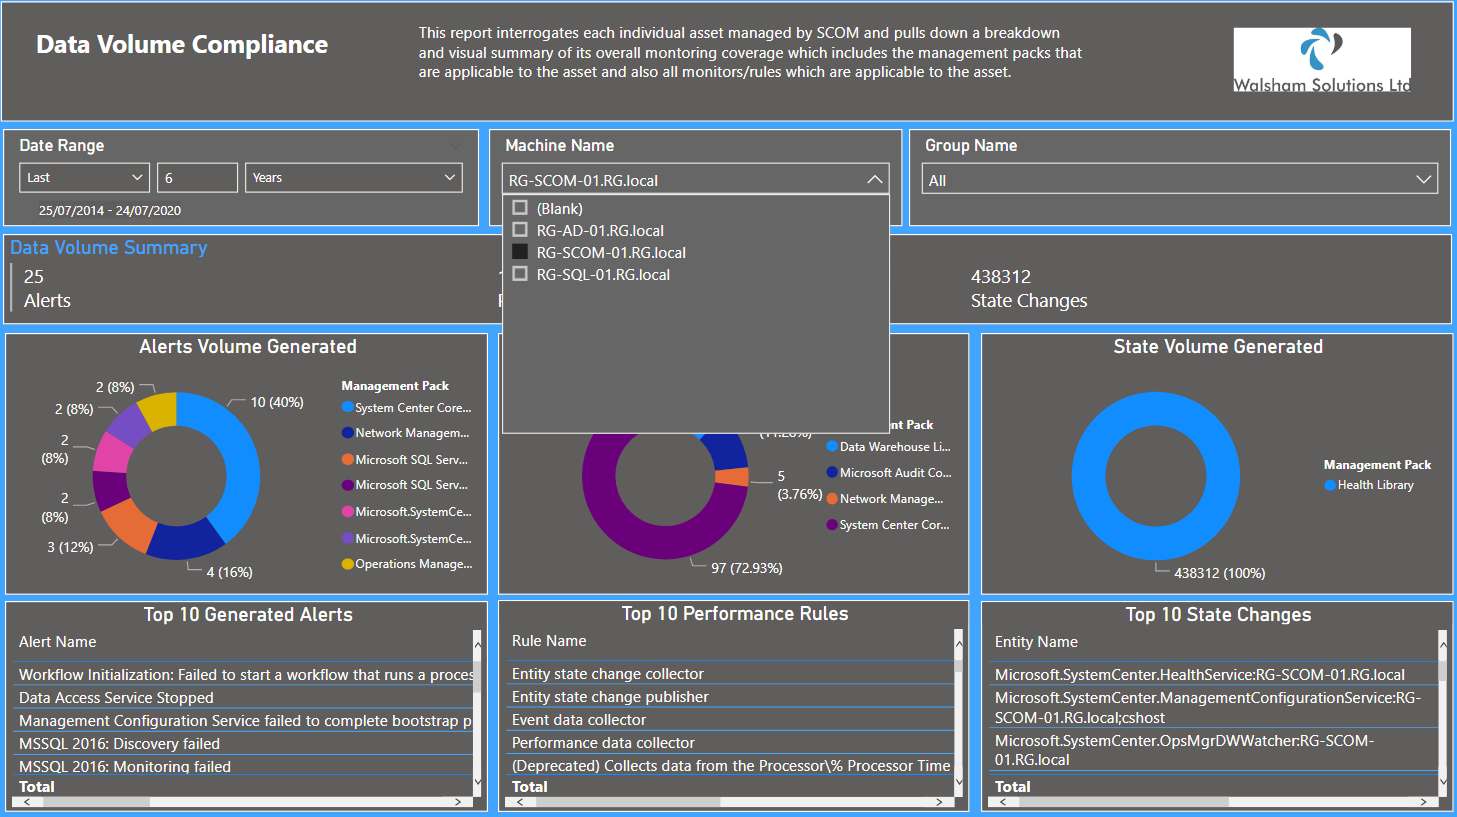
Here is an example of grouping on my SCOM Dashboard
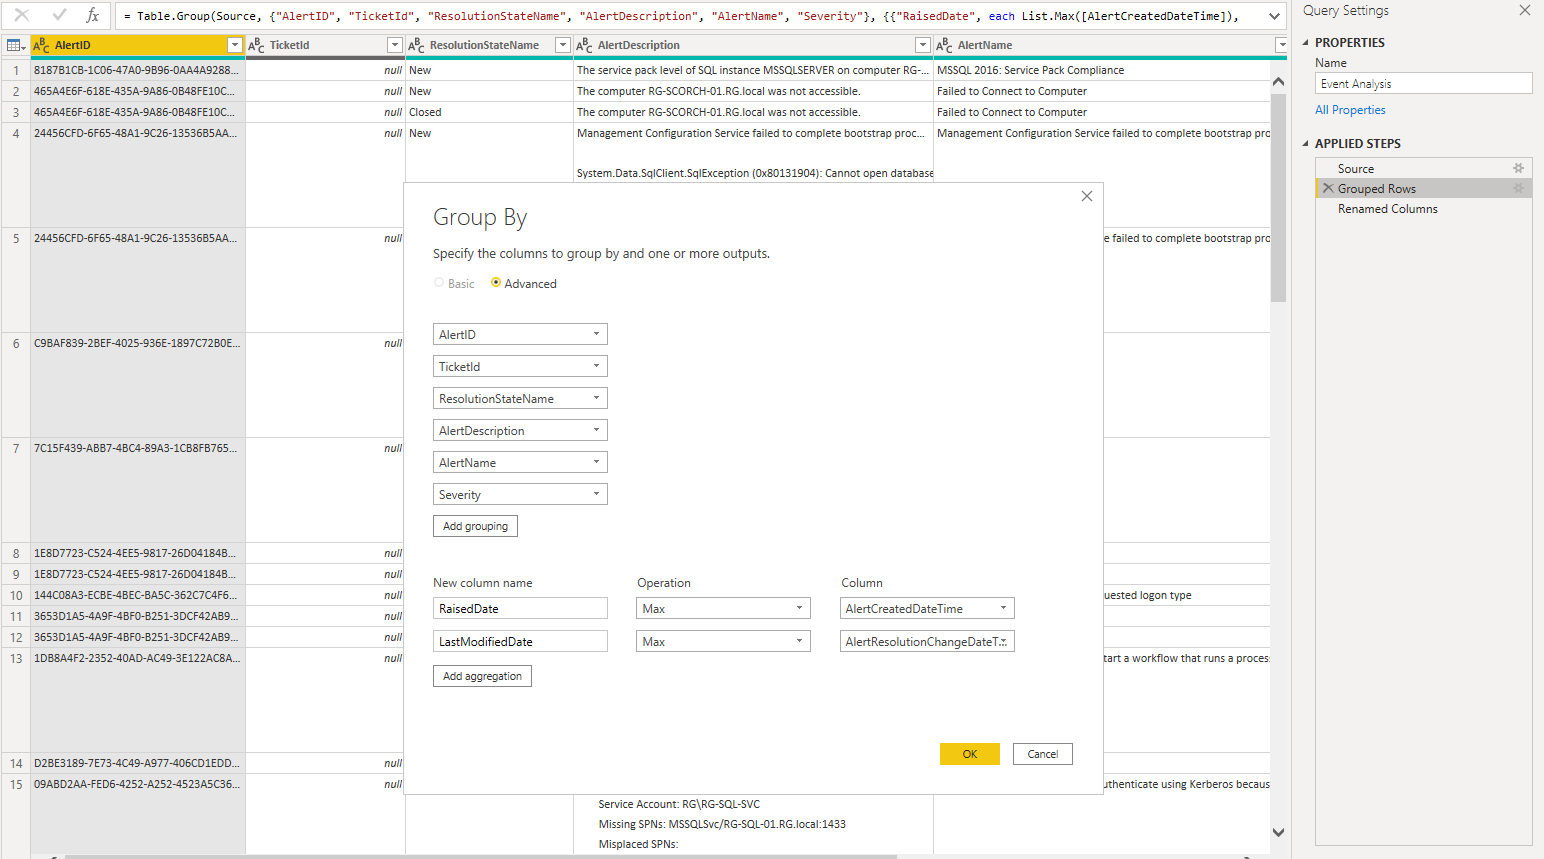
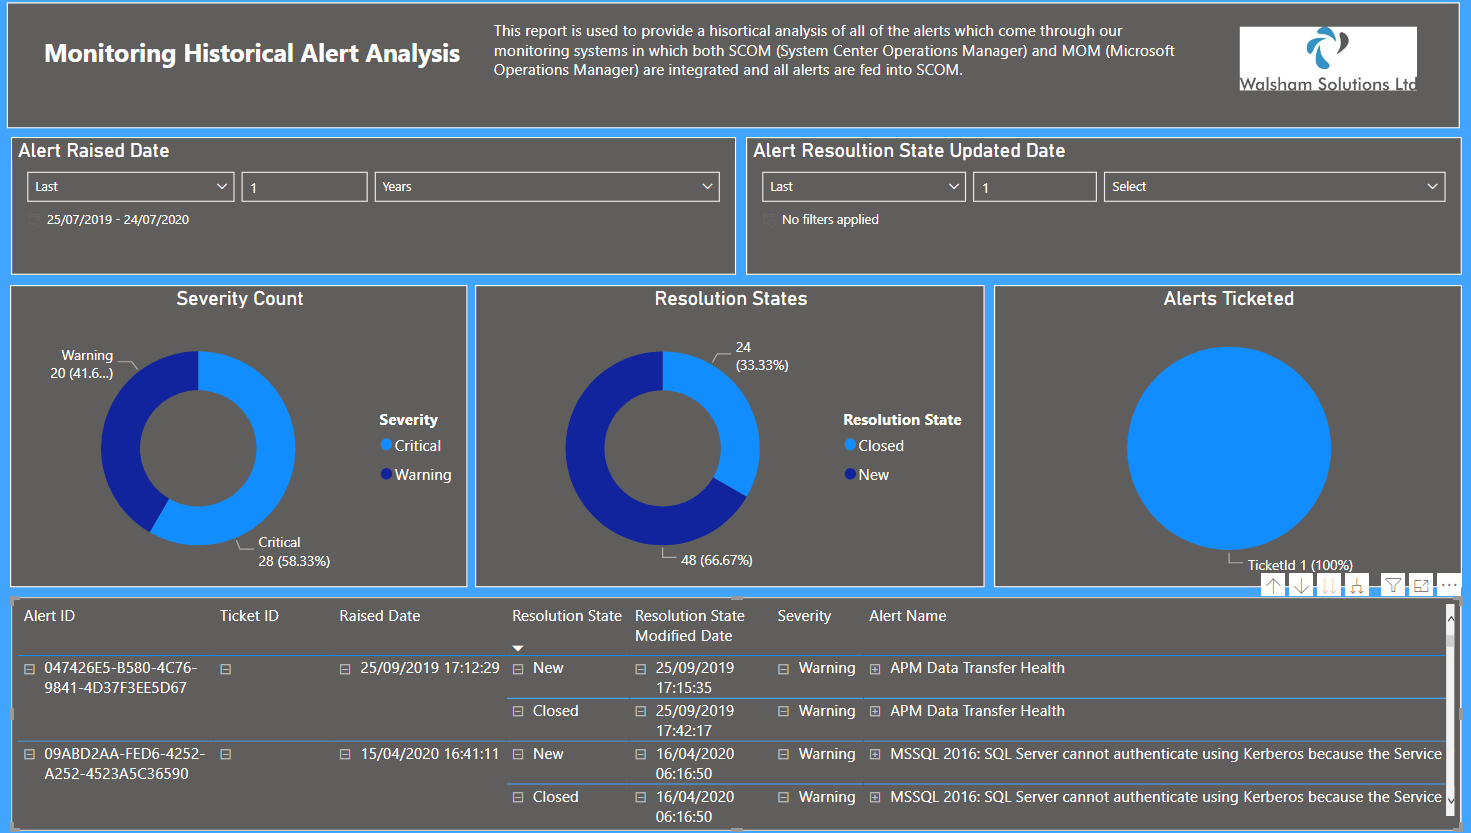
For this particular example of grouping, this is a dataset which contains every single alert and historical alert within SCOM. Where the grouping plays a part is selecting the key columns which we require.
Now with the grouping in this case we wanted to obtain the alerts which have the latest raised date and also the latest resolved date and the latest resolved date, this way we can see the latest occurance of the alert and see every single resolution state it entered until it eventually reached into a resolved state as seen below.
Standard Table vs Elaborate Visualizations
One of the elements which shine to myself and those who have used paginated reports, is the Table Wizard formats in which you can create a report where there is specifically a table of results when running the report to execute your dataset query.
For System Centre Admins these can be quite important for those which provide reports on a regular interval whether weekly, bi-weekly or monthly.
Here is a screenshot of a table view within a paginated report.
Here is a screenshot of a table within Power BI

Here is a screenshot of a visualisation type report detailing results you can see from a table
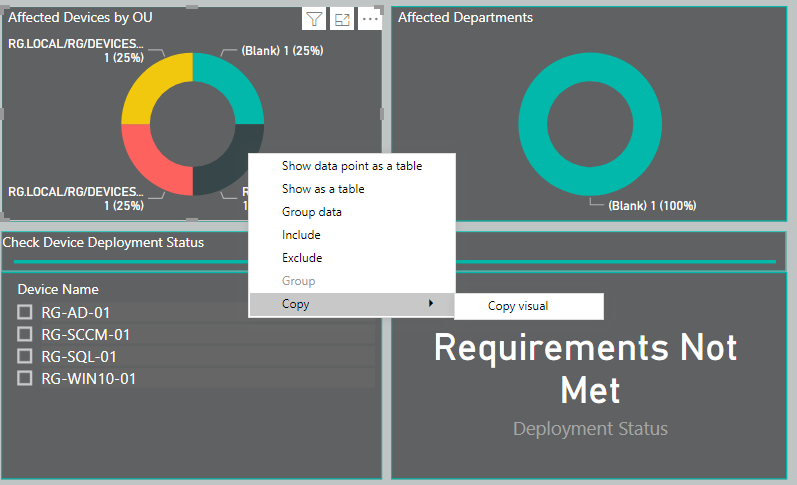
The point really being there maybe scenarios in which it maybe more convenient for you to have a page which is just a table, as opposed to a page which has multiple visualisations which you or a user which has been provided access to and have to right click and click something like "See Records" or "Show DataPoint as Table".
The result of this is similar to creating a linked report action in Report Builder.

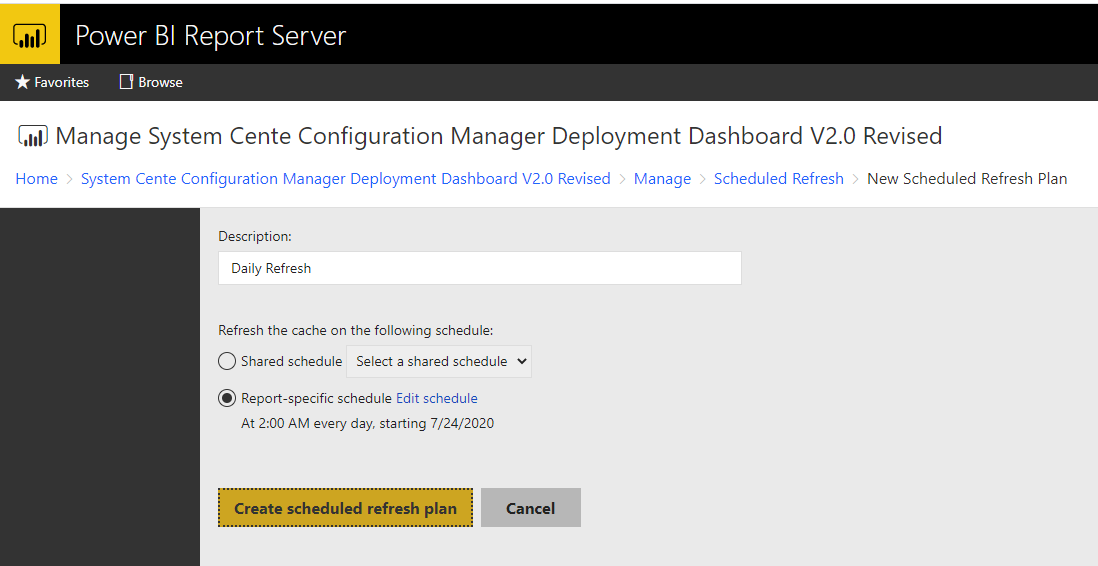
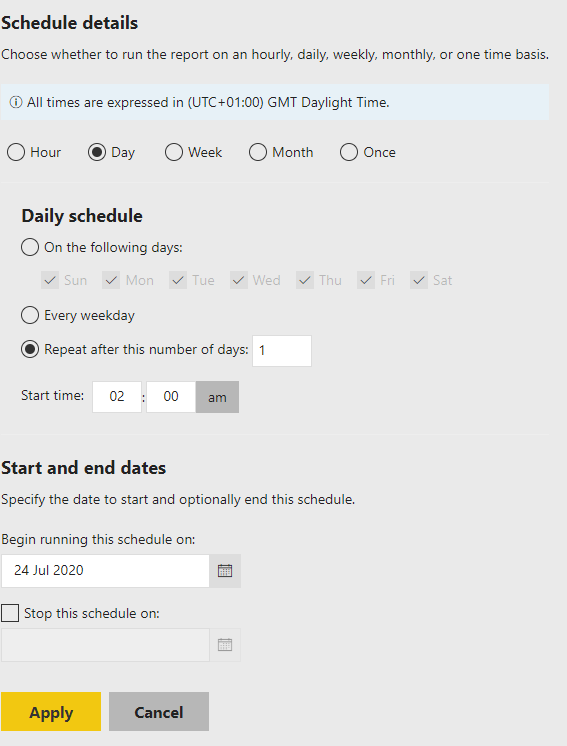
Refresh Schedules
Power BI Desktop only has the ability to manually refresh when you specifically require one. The best way to utilise refreshes on a schedule is to use Power BI Report Server, or using the Power BI service (though may require you to install a gateway https://powerbi.microsoft.com/en-us/gateway/)
It's important to know the peak times of when your system centre tools require a refresh so you can capture the information you need at the most appropriate times. Some tools such as SCCM where they have evaluation schedules will determine when the data will refresh so this can play a part in your refresh schedule also.
Other tools such as SCOM, SCORCH etc will be a bit more on demand with their data. SCSM on the other hand has Data Warehouse jobs which execute the data stagings as well as the connectors which import data into SCSM at particular intervals, so having a well thought out plan for your refresh schedules is key.
Also bear in mind if using these in Power BI service that there is a limit of 8 refreshes per day if using a free or pro license. But if you happen to have a Premium license then you can have this up to 48 times per day.
DAX Example - Custom Tables for custom definition
There are some common DAX commands which I use within my dashboards and reports. These are quite similar to the formulas which you may come across in the Report Builder however these can vary so here are some ones which I have used and the benefits in which they provide.
COUNTA
So this is great for when it comes to providing stats for table, filter card and some chart visuals. COUNTA is really to count the cells which dont have blank or empty (null) values.
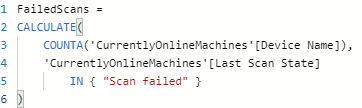
This example is for SCCM ad determines a measure which calculates how many machines have a "Scan Failed" state.
Custom Column DAX
There maybe times when you want to have some more custom definitions in a way which you can group your system centre data objects into a more friendly way of breaking down key stats. So I have an example to explain further.
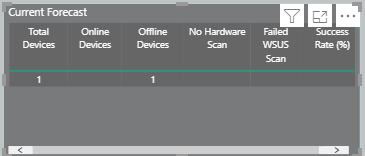
In my SCCM Deployment Dashboard there is a table which i use which is on the Collection Severity Forecast page. It shows a grouping of stats of all of the devices which online, offline etc But how it was done is key and this was done by creating a custom column using a DAX formula. Below i will give a breakdown on how this works.
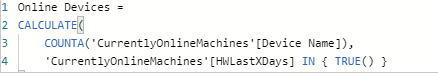
So i have a dataset called CurrentlyOnlineMachines which contains a list of all of the machines in SCCM and the timestamp of when they performed a hardware scan last.
So suppose i create my own definition of how i perceive to be an "Online" machine. For this case i would say any machine that has not had a hardware scan within the span of 2 days i would then consider to be offline.
So then i create a new column with this forumla here
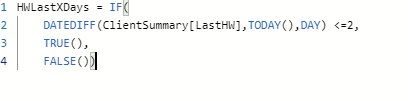
Now we have a custom column created by a DAX formula that states any machine which has not had a scan within 2 days is offline, and anything which is online has.
So now when i want to have a result of how many machines are online i then create a new measure based on a DAX query which uses the value specified in the DAX formula value above.
And now to take this a step further with more additional conditions added to a DAX query, i now want to work out what i would define as a Success criteria.
Now if you look at the current forecast table above we have online machines, offline machines, no hardware scan machines and failed wsus scan machines. Each of them created with a very similar COUNTA dax formula, we want to summarise this as one big measure. In order to do that we create the conditions to build our success criteria as seen below.
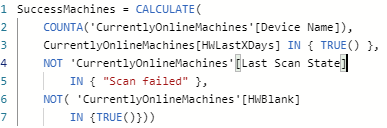
You can see here we add conditions where the machine does not show a failed scan state and also excludes machines that have no hardware scan. So this builds our success criteria.
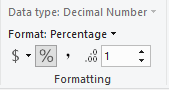
So now we want to define a success rate based on an overall percentage. For this we perform a mathematical measure which divides the SuccessMachines criteria by the total devices that are in the specific collection within SCCM.

And to ensure the format is correct we configure the following settings in the ribbon bar above
Splitting Up Dashboard to Reports
If you have a dashboard that perhaps contains multiple pages, though the convenience is that you have all the information you require in one centralized dashboard, the danger is that some of the datasets in which you have can be susbstantially larger than others, whilst some can be quite small.
Having a mixture of both of these especially when performing a refresh can cause the refresh rate to be slower and slower, especially if you are wanting to know specific information on one of the pages more critical than others.
If this scenario fits you, analyse which pages are most critical to you as well as which may be the biggest in terms of DataSet row sizes and look to which ones you will want to split up.
This way you can have a refresh schedule set on your Power BI Report Server to be more optimized with the focus on datasets which are specific to the report you have made as a singular report.
Summary
Overall these are the guidlines and best practices which i've developed when it comes to optimizing the output of data retreivied through the System Center toolsets to display the most accurate data possible and without throttling resources on the SQL infrastructure.
There will be more additions to this article as we go along and also welcome other points, tips or best practices which would indeed help the optimisiation of System Centre data