
System Center Configuration Manager Deployment Dashboard V2.0
Back and Revamped with greater features!

Introduction
Here is the new and improved version of the System Center Configuration Manager Deployment Dashboard with its new release being labelled as V2.0
It's origins come based on the first version of this PowerBI dashboard and this was then based on the original Report Builder version which can also be downloaded on the TechNet gallery - https://gallery.technet.microsoft.com/SCCM-Deployment-Dashboard-63baf9b6
This follows on from the previously released second edition of the Software Update Dashboard which has had a huge make over with additional important features added which will be explained in each section.
Universal New Features
- Revamped Design - To make it stand out more and pop especially with vert business critical information there is now more focus on the areas which are needed to be focused on, especially when issues become critical or soon to be critical
- Query Reduction - The amount of queries used have now been reduced to speed and optimize the overall dashboard, so any refreshes should be a lot quicker going forward
- Query Organizations - If needing to change anything on the dashboard all of the queries have now been sorted into folders which are specific to each page so the organisation is alot better.
- Reduced Relationships - Relationships between tables has also been optimized to provide better performance.
- Restructured Queries - Have sorted through various queries pulling information which again is alot more enriched with important information and columns not in use have been minimized.
- DAX Enrichment - More DAX functions have been used to provide better statistical analysis overall
Where to Download
The dashboard can be downloaded on the website right here
https://irp-cdn.multiscreensite.com/c1f89e50/files/uploaded/SCCM%20Deployment%20Dashboard%20V%202.0.zip
You can also obtain the dashboard from the PowerBI Dashboard Solutions tab from the dashboard gallery
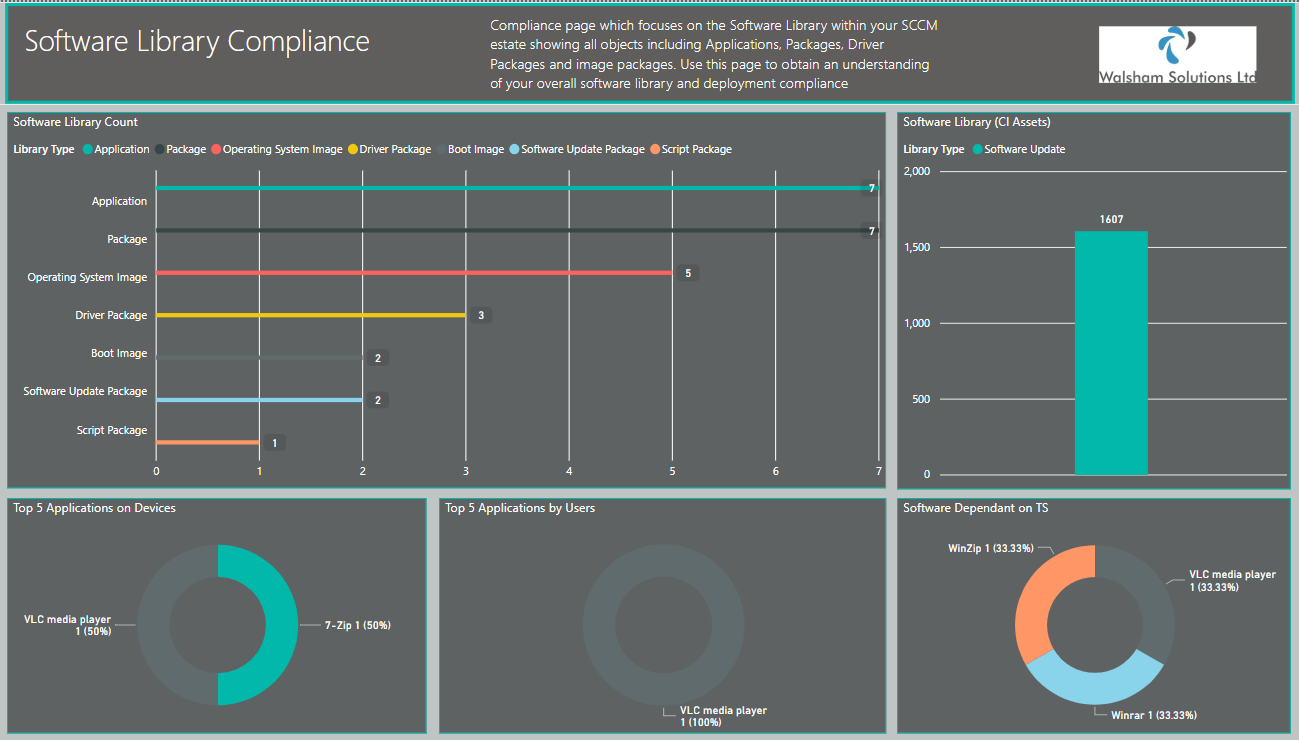
Software Library Compliance Page
Here is how the older version looked of this page
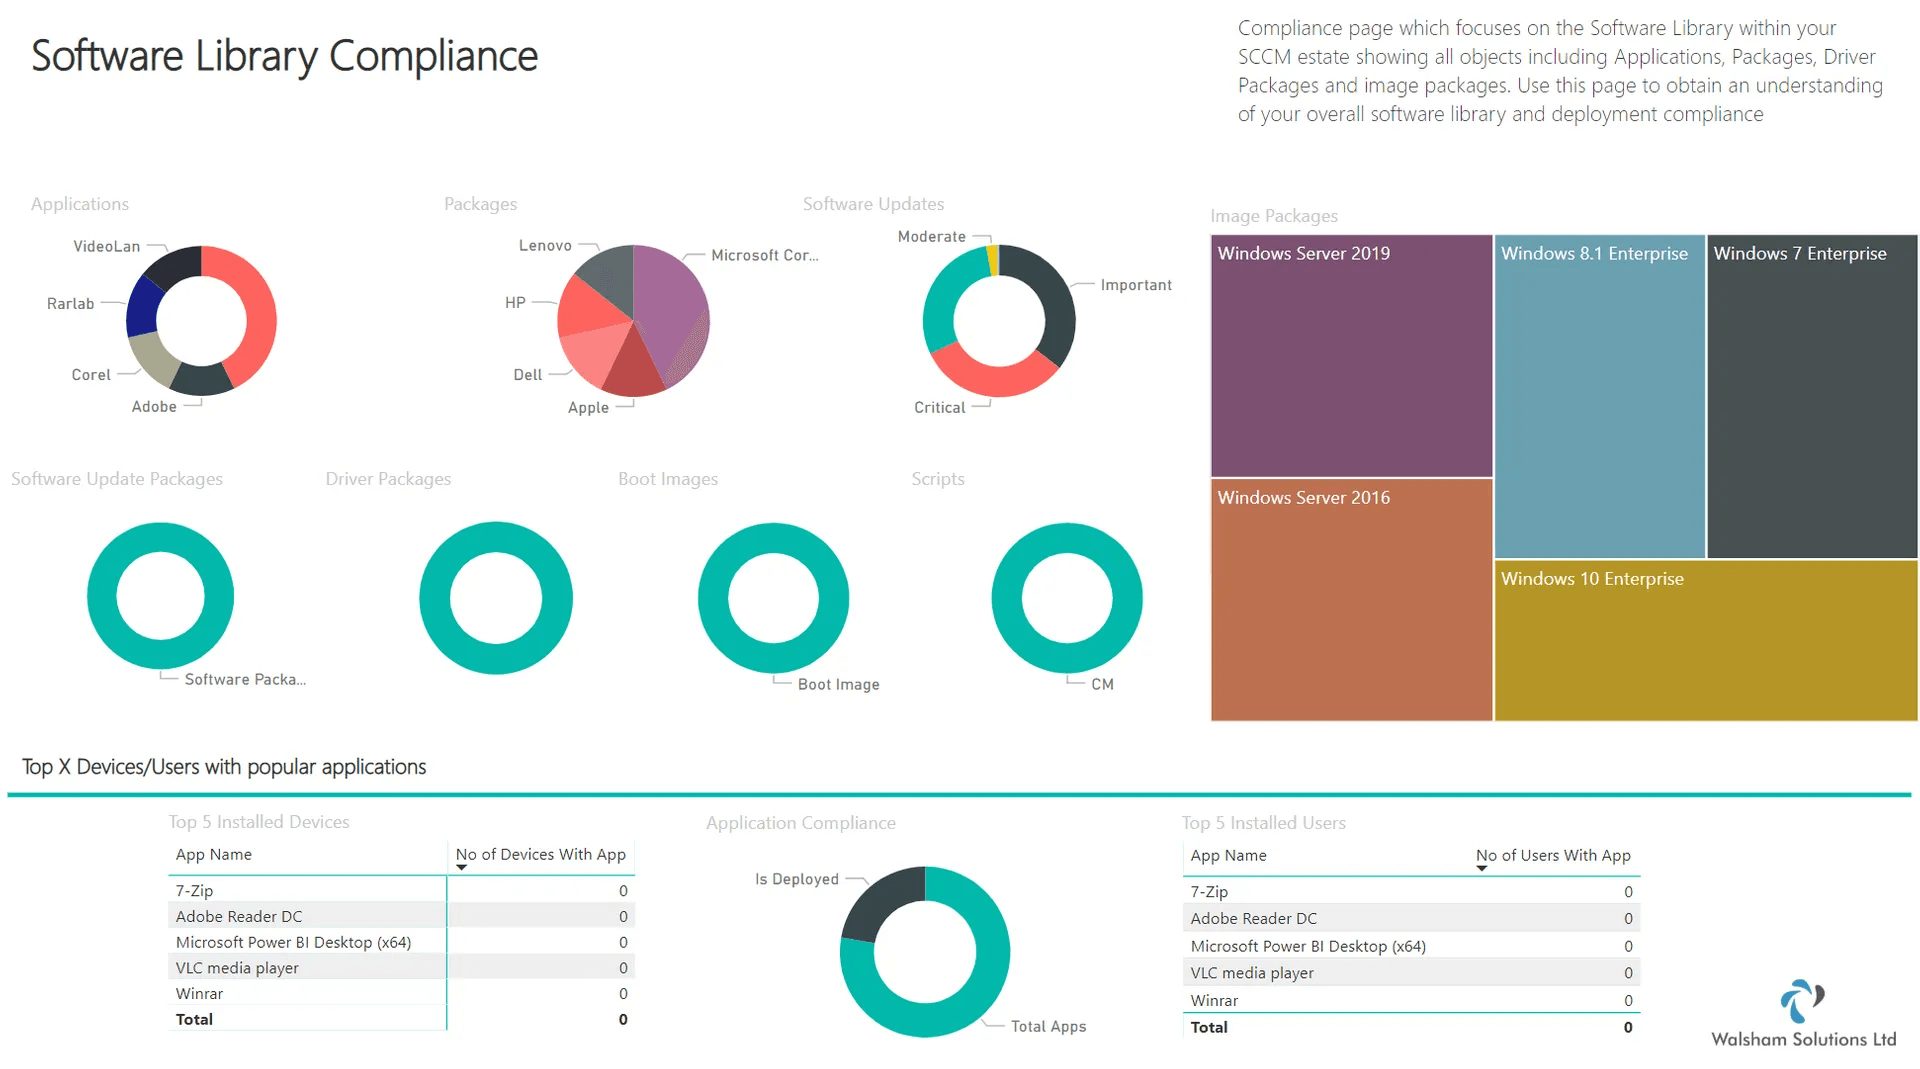
Below is now the new improved version of the page
New Features for the page
- Consolidated Visual for Software Library - Now you can see the categorized structure of all of the content which you have in your Software Library which is also reflective of how it's categorized within the Configuration Manager console. Also using the drilldown facility allows you to look into the manufacturers of each if wanting to see a more granular search
- Software Library (CI Assets) - Here you can see a count for all of the individual software updates and also the drivers which are within your software library estate just to make it cleaner from the visual on the side.
- Top 5 Applications Visuals - Revamped from using a table to see a list of them now you can see an exact count of the most installed applications per user or device and in a more appealing visual way
- Software Dependant on TS Visual - Here you can see which applications are part of a Task Sequence. Of course to get a better understanding of which task sequence they are a part of is best to go to the Operation System Compliance page for this
- Enriched information for exporting - Each of the categories contain the folder path to the object within the console for those who have complicated folder structures in your consoles.
Collection Severity Forecast
Here is how the older version looked of this page
Below is now the new improved version of the page
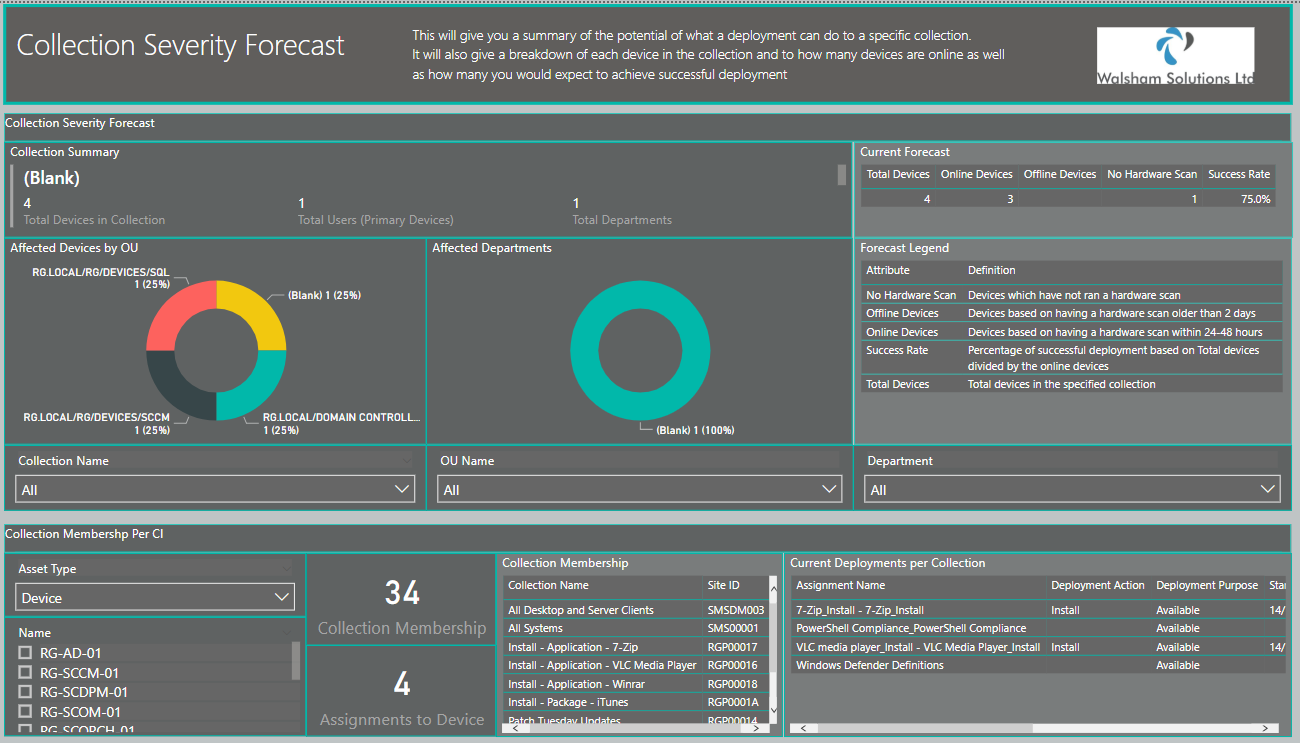
New Features on the Page
- Current Forecast Table - So similar to the second release of the Software Update Dashboard this contains a forecast made up of all the devices, online/offline and those with no hardware scan and will work out what the success rate will be of this potential deployment. The legend table gives a breakdown as to what all of the attributes mean in greater detail
- Departments/OU Severity - This has been revamped now to show only the OUs which the devices are specifically in as opposed to the entire tree making it more complicated to understand the stats, and also showing which users/departments are also affected. The severity manual part has been removed as better visuals give it a better look into the collections.
- Additional Slicers - Now can break down into the Collections, OUs and Departments if wanting to be more granular.
- Collection Membership Per CI
- This is a new feature added! Now when we have several deployments and collections going and we have absolutely no idea what machines are a part of, this has now changed! So you can select between Devices or Users and selecting a device now tells you the following;
Total Collections its a part of
Deployments going to that device/collection
It makes investigating so much easier :)
Application Deployment Compliance Page
Here is how the older version looked of this page
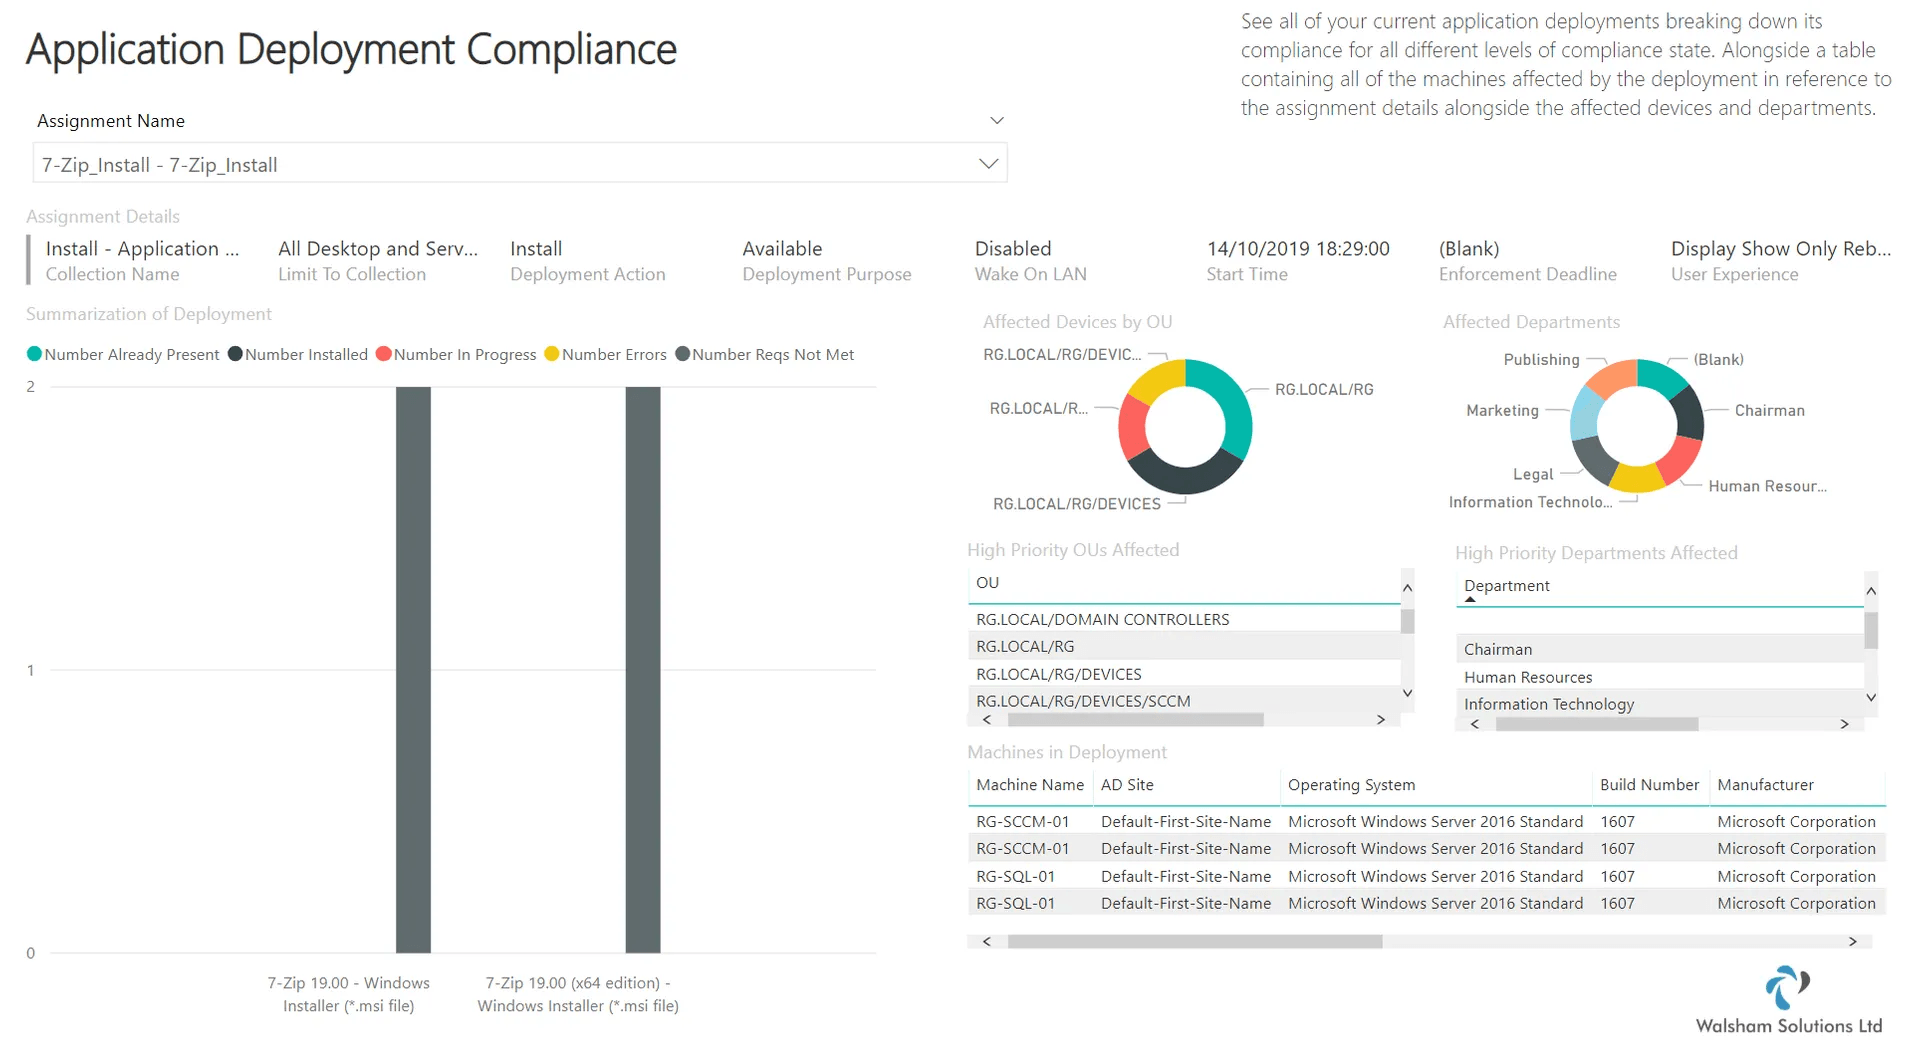
Below is now the new improved version of the page
New Features on the Page
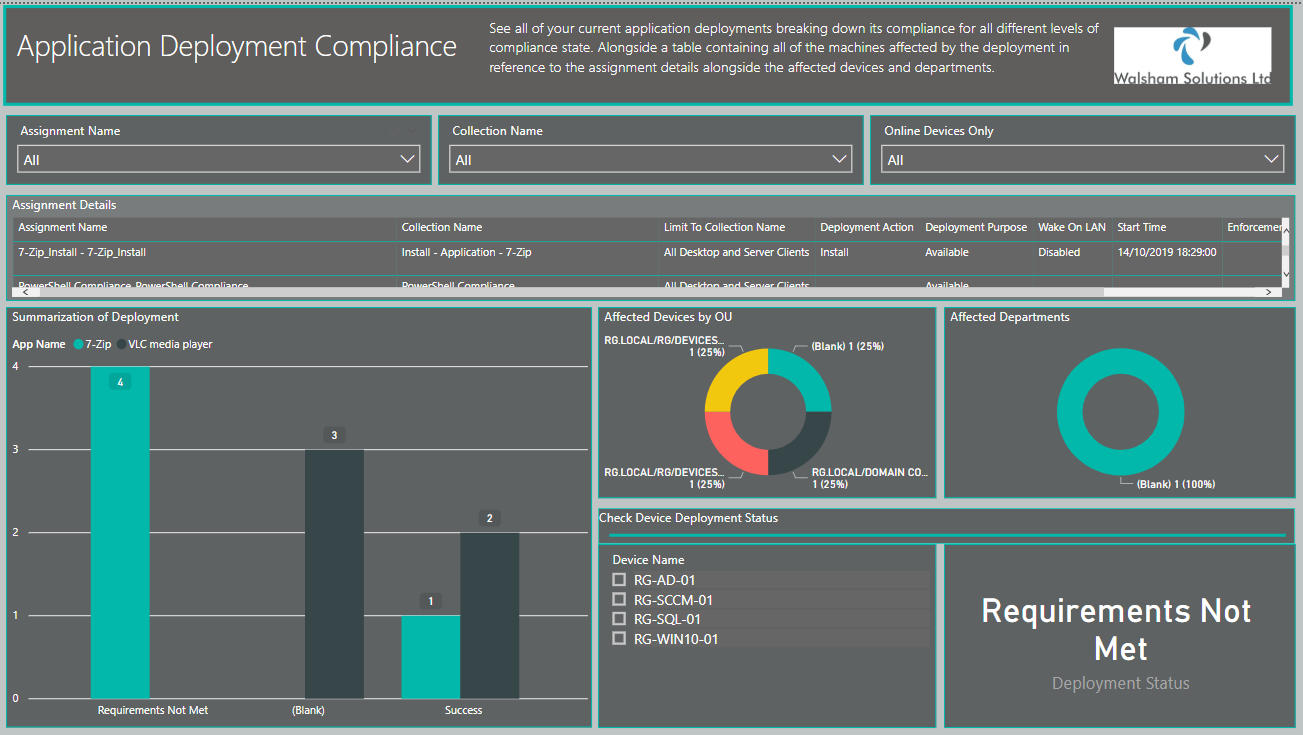
- Additional Slicers for Granular Searching - Sort by Assignments and collections to alter all of the information on the page
- Online Devices Only Slicer
- This is similar to the feature added in the second release of the Software Update Dashboard where you can limit the compliance to only Online Devices.
(Note: if wanting to see all devices just click nothing for All, choosing false will filter it by only offline devices) - Summarization of Deployment Changes - Instead of showing it as a numbered statistic, you can now see the records of each status of deployment for each application displayed within the visual.
- Affected OUs & Devices - Better analysis on the OUs in which the devices reside in which is great when it comes to analysing which GPOs could or could not be causing an issue. Departments showing the departments of the primary users which it affects.
- Check Device Compliance Status - New feature added in which you can select any individual machine within the deployment and you can see what status the deployment for that machine is in, which is alot easier than searching through the exported records or any other means.
Package Deployment Compliance Page
Here is how the older version looked of this page
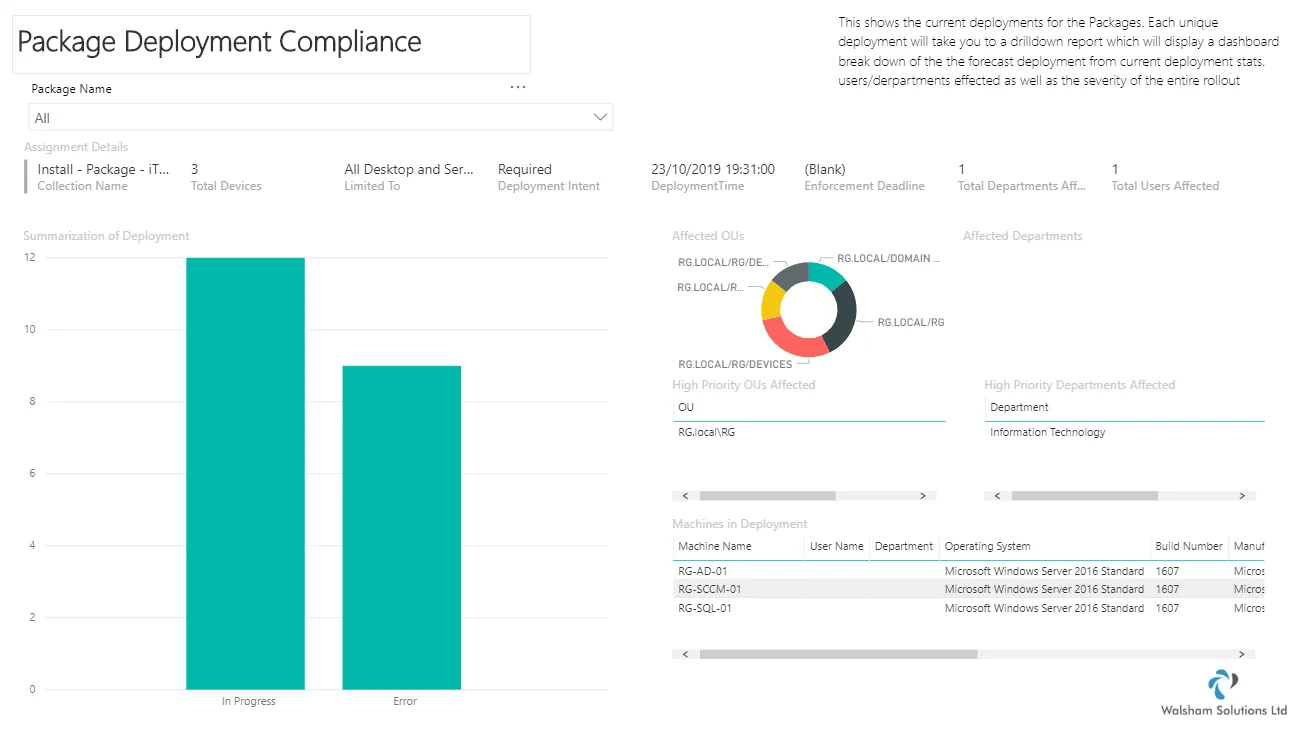
Below is now the new improved version of the page
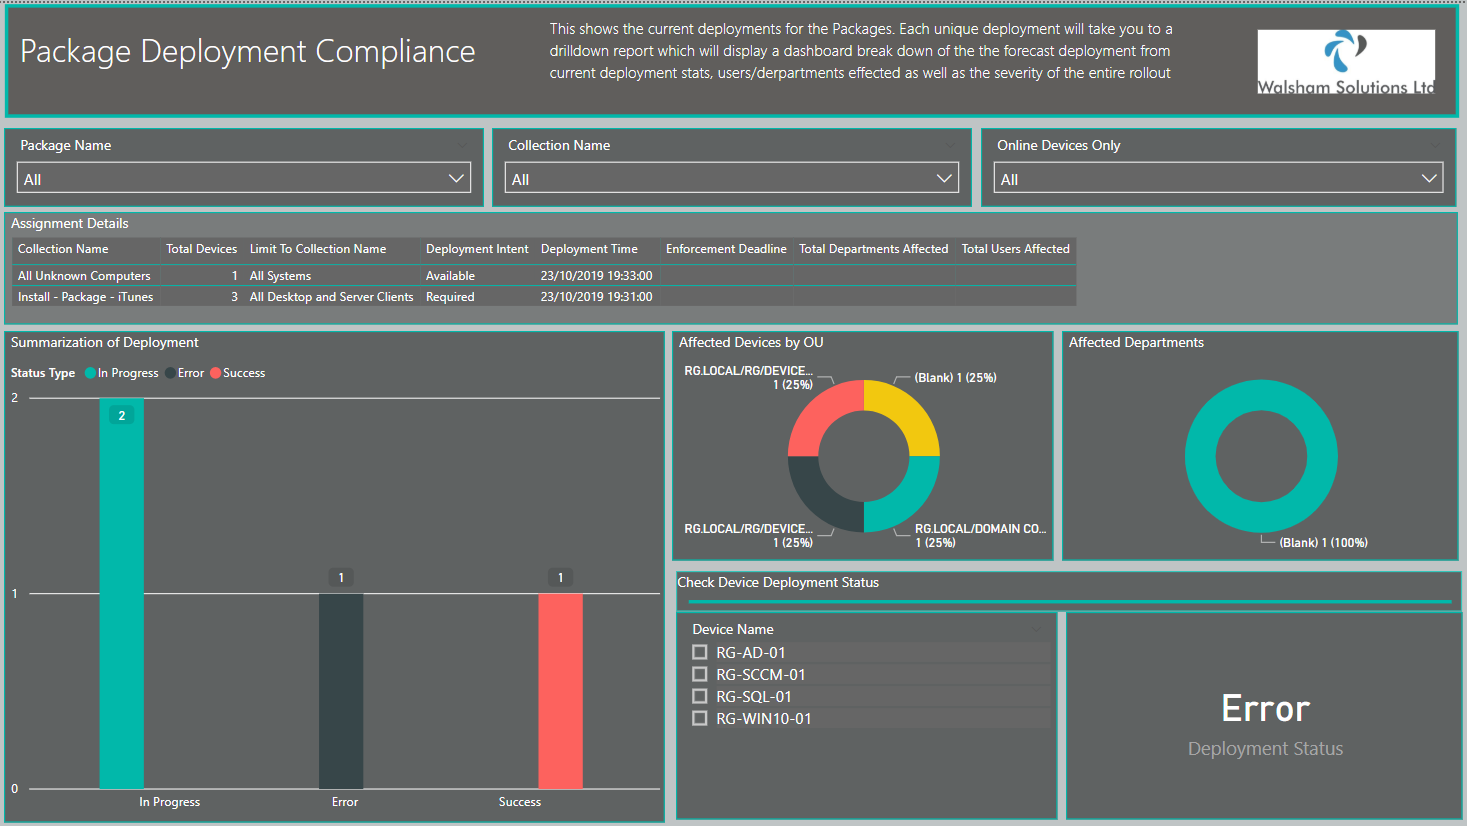
New Features on the Page
(Note: if wanting to see all devices just click nothing for All, choosing false will filter it by only offline devices)
Software Update Deployment Compliance Page
Here is how the older version looked of this page
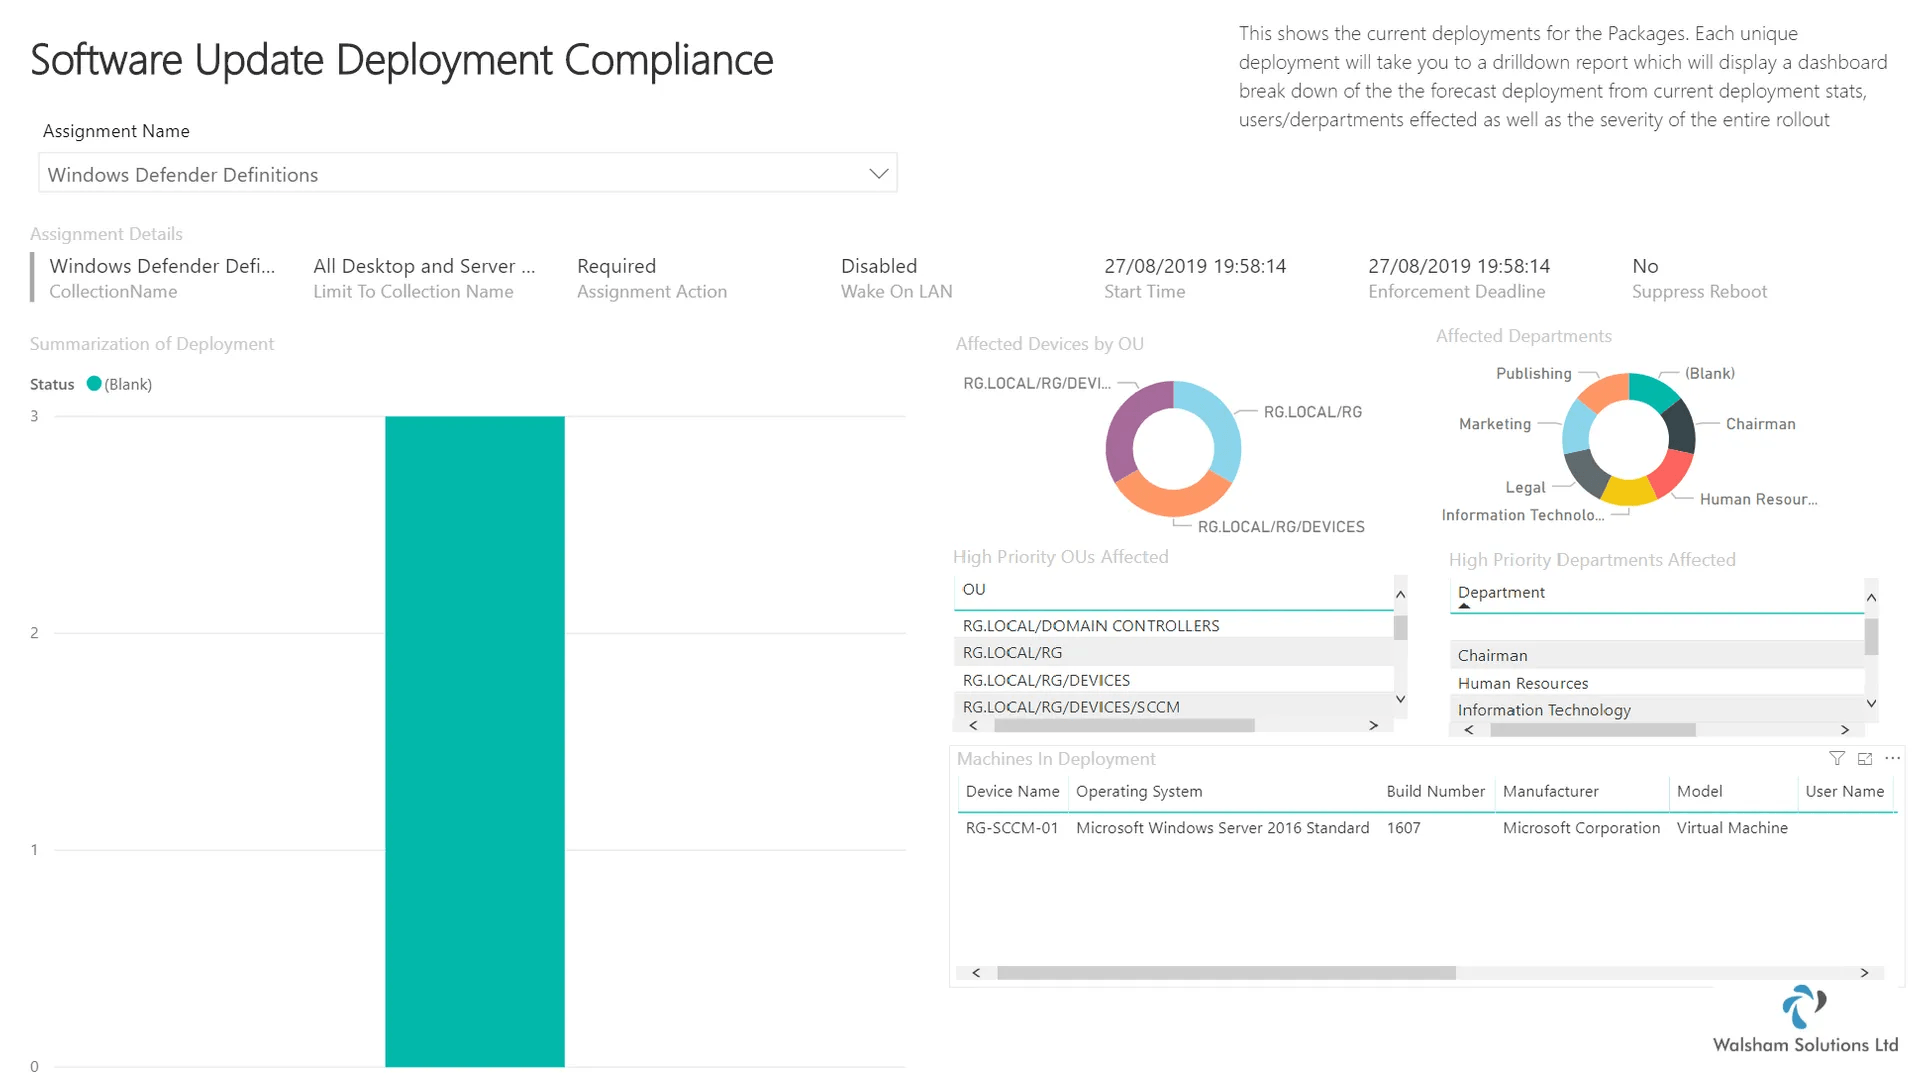
Below is now the new improved version of the page
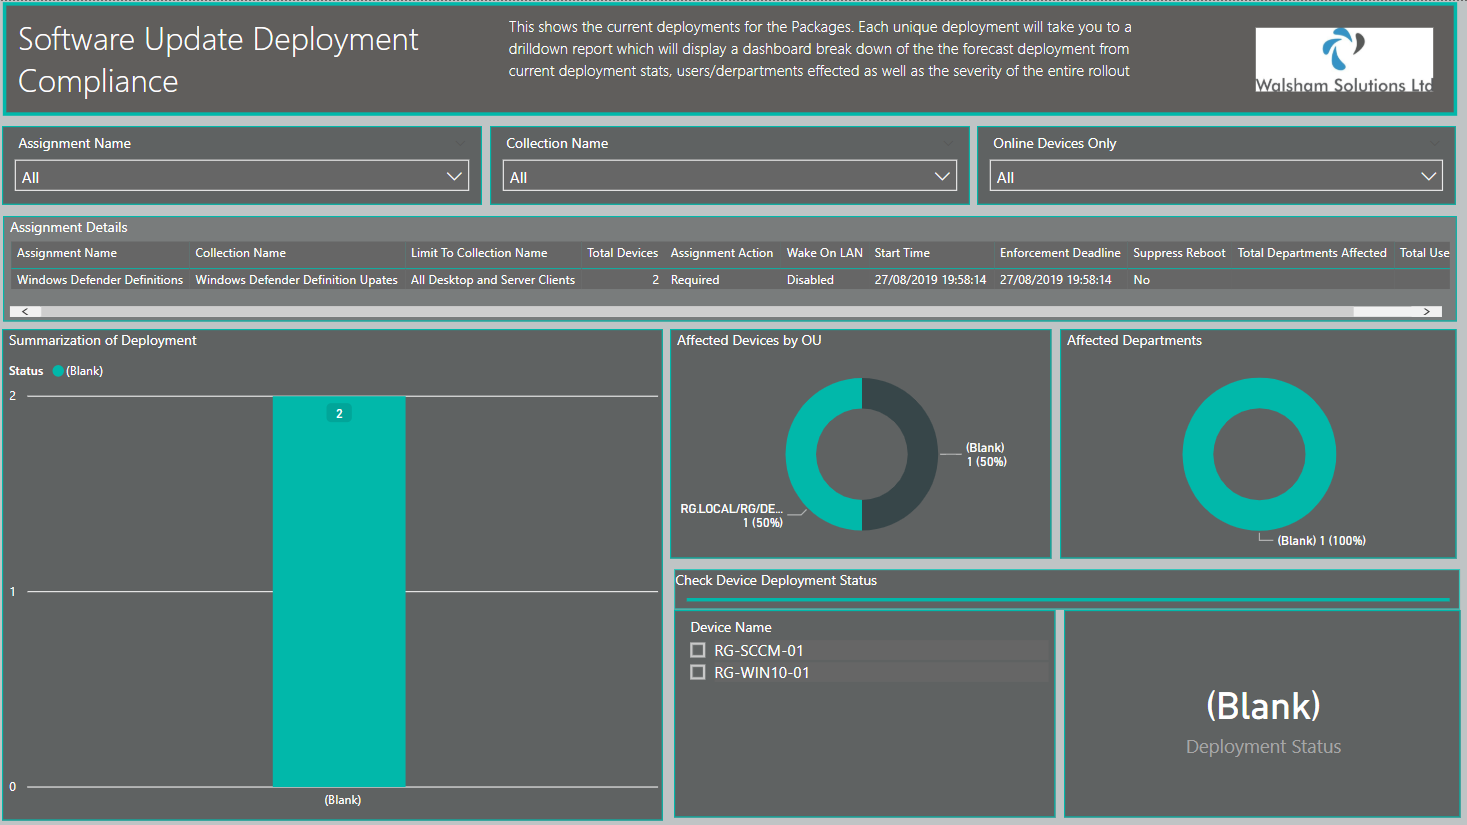
New features on the Page
(Note: if wanting to see all devices just click nothing for All, choosing false will filter it by only offline devices)
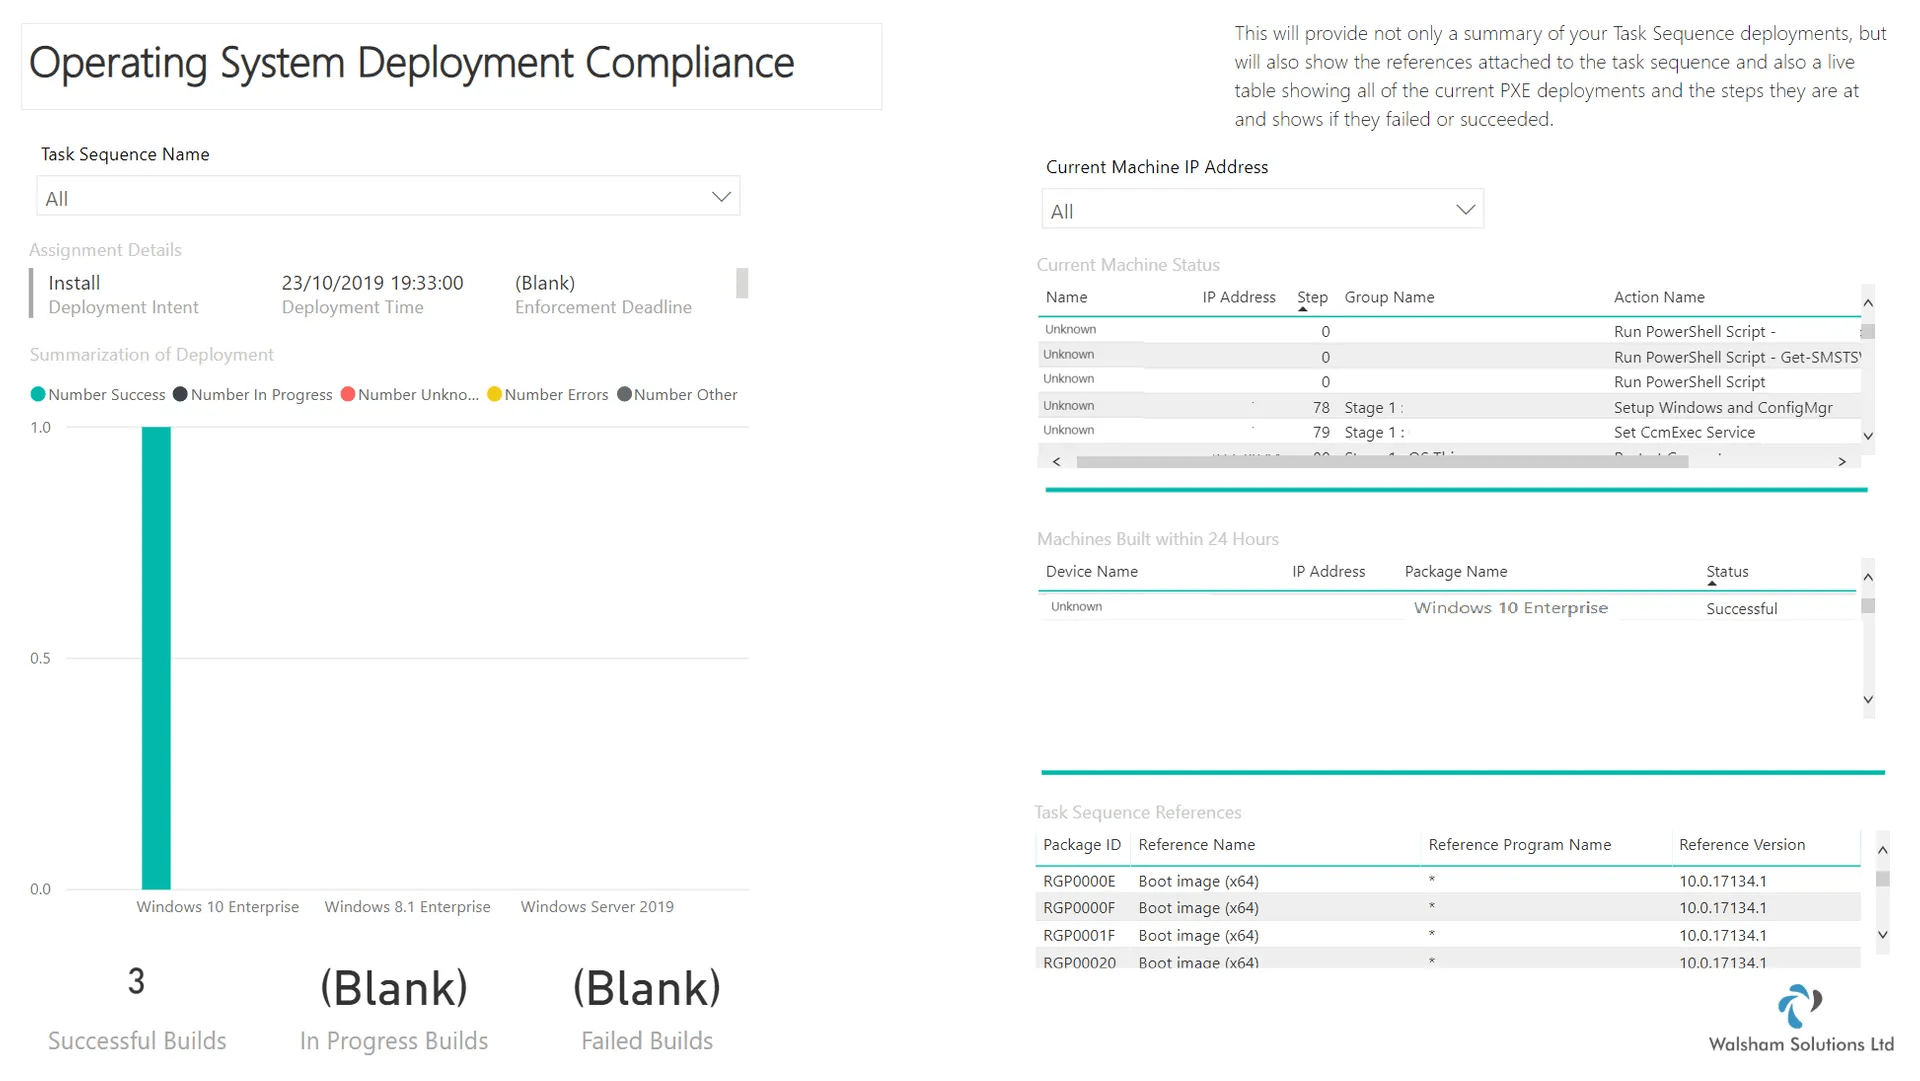
Operating System Deployment Compliance Page
Here is how the older version looked of this page
Below is now the new improved version of the page
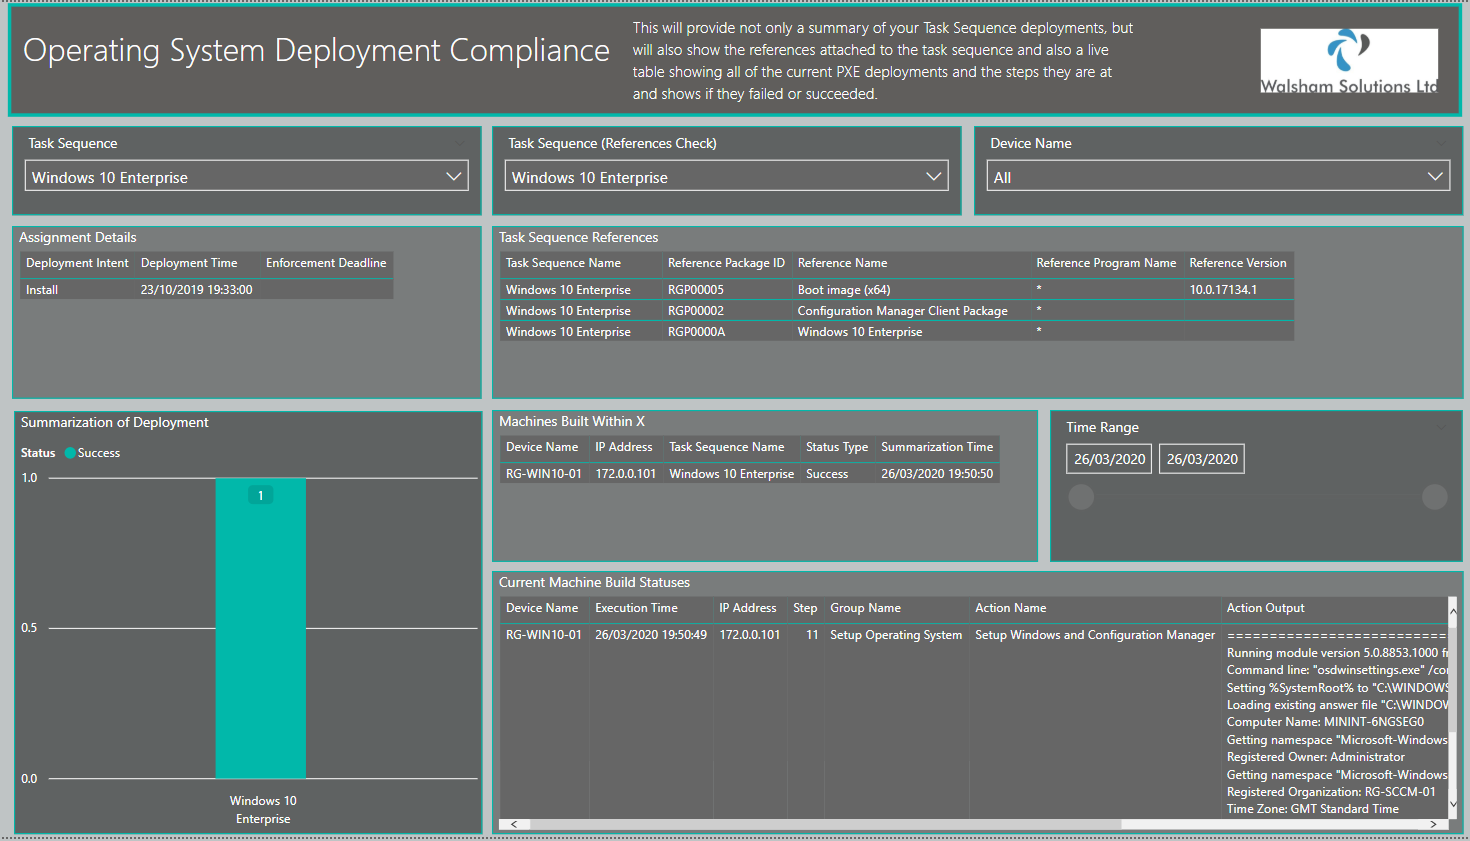
New Features on the Page
This page has had a complete revamp!
Now for what it doesn't necessarily doesn't make up as visually appealing (maybe down to the fact i have one Task Sequence with one deployment :) ) it does make up in very huge detail with the below bulletpoints!
- Machines Built within X - This shows all of the machines that were built within 24 hours. Course if needing to track a more historical background this can be done too using the filter slicer
- Current Machine Build States - This is a fantastic feature and also completely revamped! So for the last version it tracked the entire task sequence, though was great for detail may have looked confusing or a bit too much information. This time it shows the exact step its on, and you can see whether it succeeded in building or if it failed on that step which allows for great tracking whether using log captures or trying to watch the machine manually.
- Task Sequence References - You have an additional slicer which controls this now so you can see exactly which package is inside a Task Sequence which is great for troubleshooting if you run into any issues in which the task sequence will not run due to a package ID it is complaining about
Upgrade Deployment Compliance
Here is how the older version looked of this page
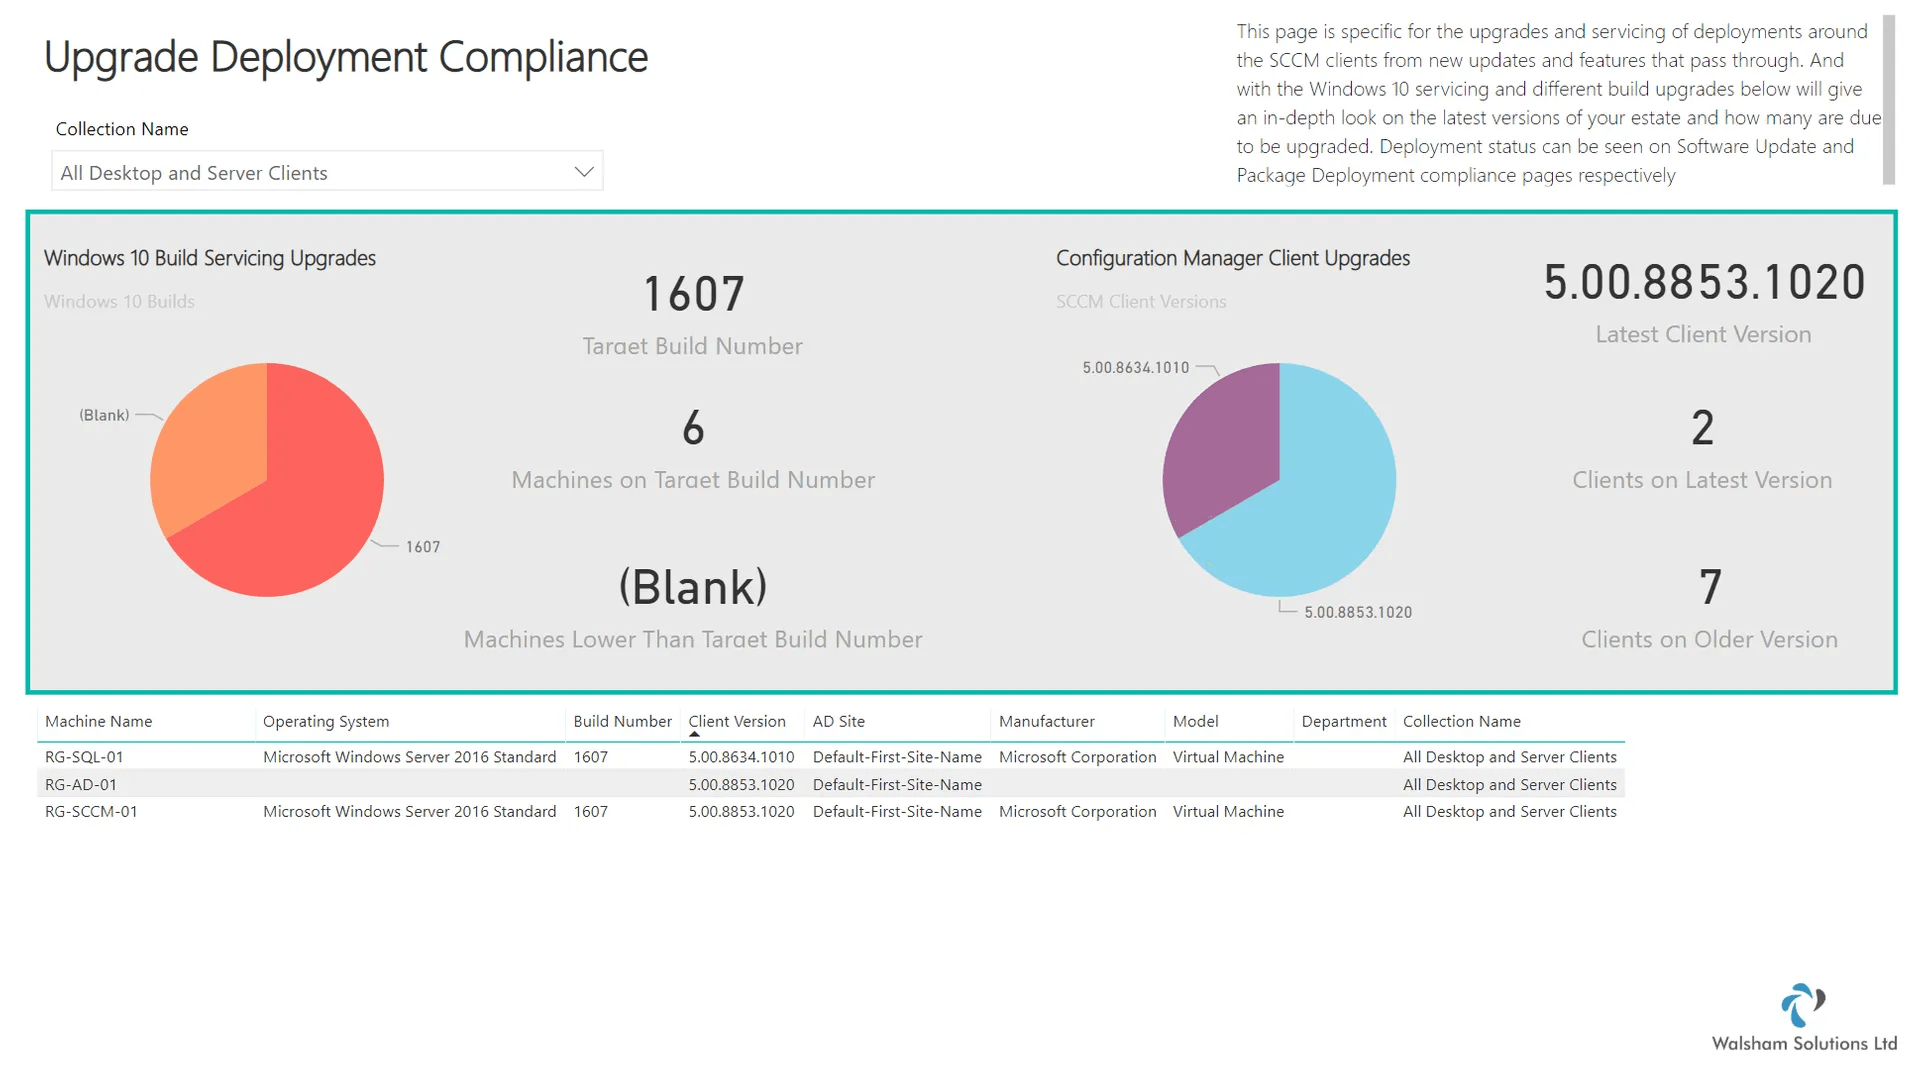
Below is now the new improved version of the page

New features on the Page
Configuration Baseline Compliance Page
Here is how the older version looked of this page
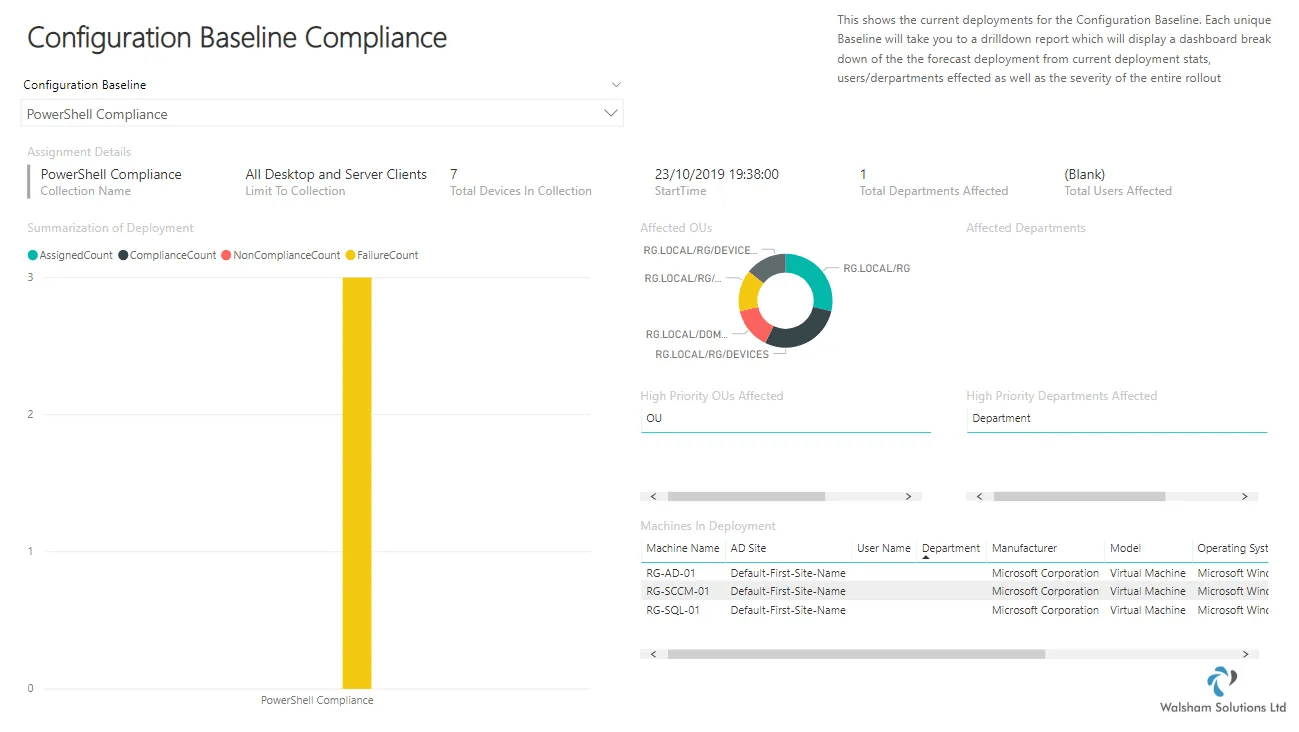
Below is now the new improved version of the page
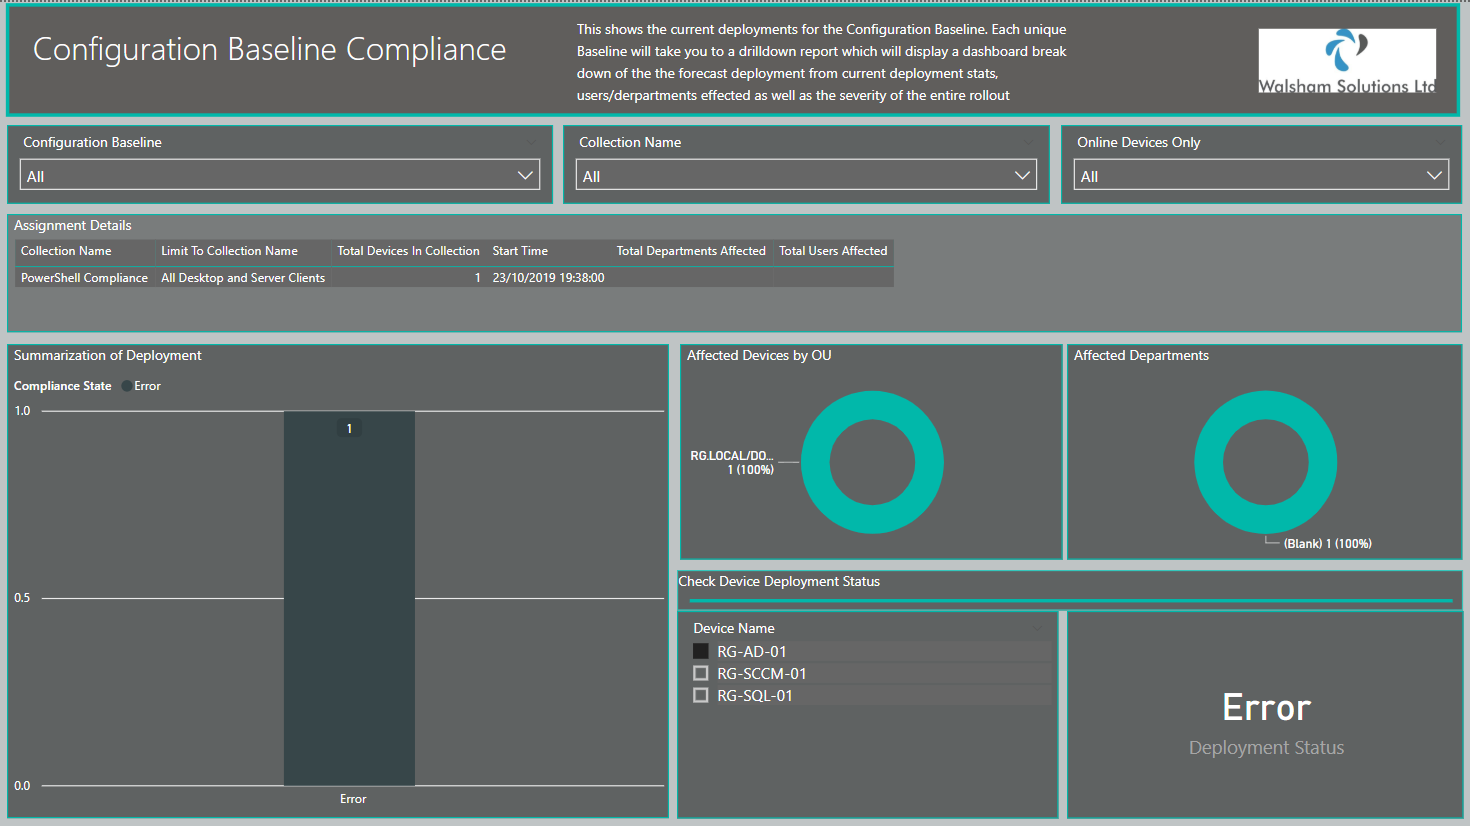
New features on the Page
(Note: if wanting to see all devices just click nothing for All, choosing false will filter it by only offline devices)
Troubleshooting
Timeout Issues
If experiencing any issues in regards to queries timing out then ensure you edit the query and enter a time frame which is suitable for your command timeout properties to ensure it runs correctly
- Open External Data - Edit Queries
- Go to the query on the right hand pane select the wheel icon where it says source
- Enter the Command timeout properties then click OK
- Then in the top right hand corner select Apply and Close
Online/Offline Devices Setting
This is currently controlled by a DAX query column called "HWOlderThanXDays", if you wish to change the value to something different to decide how you determine online/offline devices to the following;
(Note: Most of the queries with "Assets" on it and the "System OU Collections" datasets have this configuration)
- Go to either dataset listed above on the right hand side
- Dropdown the columns and double click the "HWOlderThanXDays" column
- You should then see the formula dropdown, change the value from from "2" to another value (you can also change the name of the column too which is before the "=" sign
- Click the tick sign to approve this
Queries Complaining of "Departments" Attribute
As the dashboard has a utilisation of obtaining affected OUs and more specifically departments, an important attribute required in this is that the Users discovery method is inventorying the "Departments" attribute.
If you get any issues regarding this perform the following.
- Open the Configuration Manager Console
- Go to Administration Tab
- Go to Hierarchy - Discovery Methods - Active Directory Users Discovery and right click and go to properties
- Go to the Active Directory Attributes tab and add the "Department" attribute on the left by clicking Add
- Click OK to accept the changes and select the "Run Full Discovery" button or wait until the next schedule runs.
Queries Complaining of "Departments" Attribute (Continued)
If you experience issues in which the "Departments" attribute has been enabled but you are still getting errors run a query in your SQL Management Studios "select * from v_r_user"
If your column is showing as "Department" and not "Department0" then there is a fix for this
- Open PowerBI Desktop Application
- Open the Dashboard
- Click the External Data - Edit Queries
- Go to the query which has an exclamation mark and click it. In the right pane go to the Source (top option) and click the wheel to see its query.
- Look for a line which says " v_r_user.department0 " and replace it with " v_r_user.department As Department0 "
As the dashboard depends on the department0 naming convention this should fix the problem. The reasoning for the difference of the names when it comes to enabling attributes to be discovered from your discovery methods could be down to perhaps the collation of the SQL Instance. But in case you do have this issue follow the steps above to resolve.