
System Center Configuration Manager Software Update Dashboard - Version 2.0
Huge advancements made!

Here we have the brand new and improved version of the System Center Configuration Manager Software Update Dashboard. This is very similar to the first one which came out which is still available here https://gallery.technet.microsoft.com/SCCM-Software-Update-8db3e98d
And of course the original version was based primarily on the report builder version, which can also still be accessed here https://gallery.technet.microsoft.com/SCCM-Software-Update-2dbd8d6b
This dashboard has had a completely different look altogether, though displaying the same information however a lot more enriched with detail, information and great visuals which will allow you to pull great exported reports from.
I will step through each change so that we can see the comparable differences and i will also list the new features according to each individual page
Universal New Features
- Revamped Design - To make it stand out more and pop especially with vert business critical information there is now more focus on the areas which are needed to be focused on, especially when issues become critical or soon to be critical
- Query Reduction - The amount of queries used have now been reduced to speed and optimize the overall dashboard, so any refreshes should be a lot quicker going forward
- Query Organizations - If needing to change anything on the dashboard all of the queries have now been sorted into folders which are specific to each page so the organisation is alot better.
- Reduced Relationships - Relationships between tables has also been optimized to provide better performance.
- Restructured Queries - Have sorted through various queries pulling information which again is alot more enriched with important information and columns not in use have been minimized.
- DAX Enrichment - More DAX functions have been used to provide better statistical analysis overall
Where to download
The dashboard can be downloaded on the website right here
https://irp-cdn.multiscreensite.com/c1f89e50/files/uploaded/SCCM%20SUP%20Dashboard.zip
You can also obtain the dashboard from the PowerBI Dashboard Solutions tab from the dashboard gallery
WSUS Sync Catalog Compliance Page
Below is the old version of the page in the previous dashboard
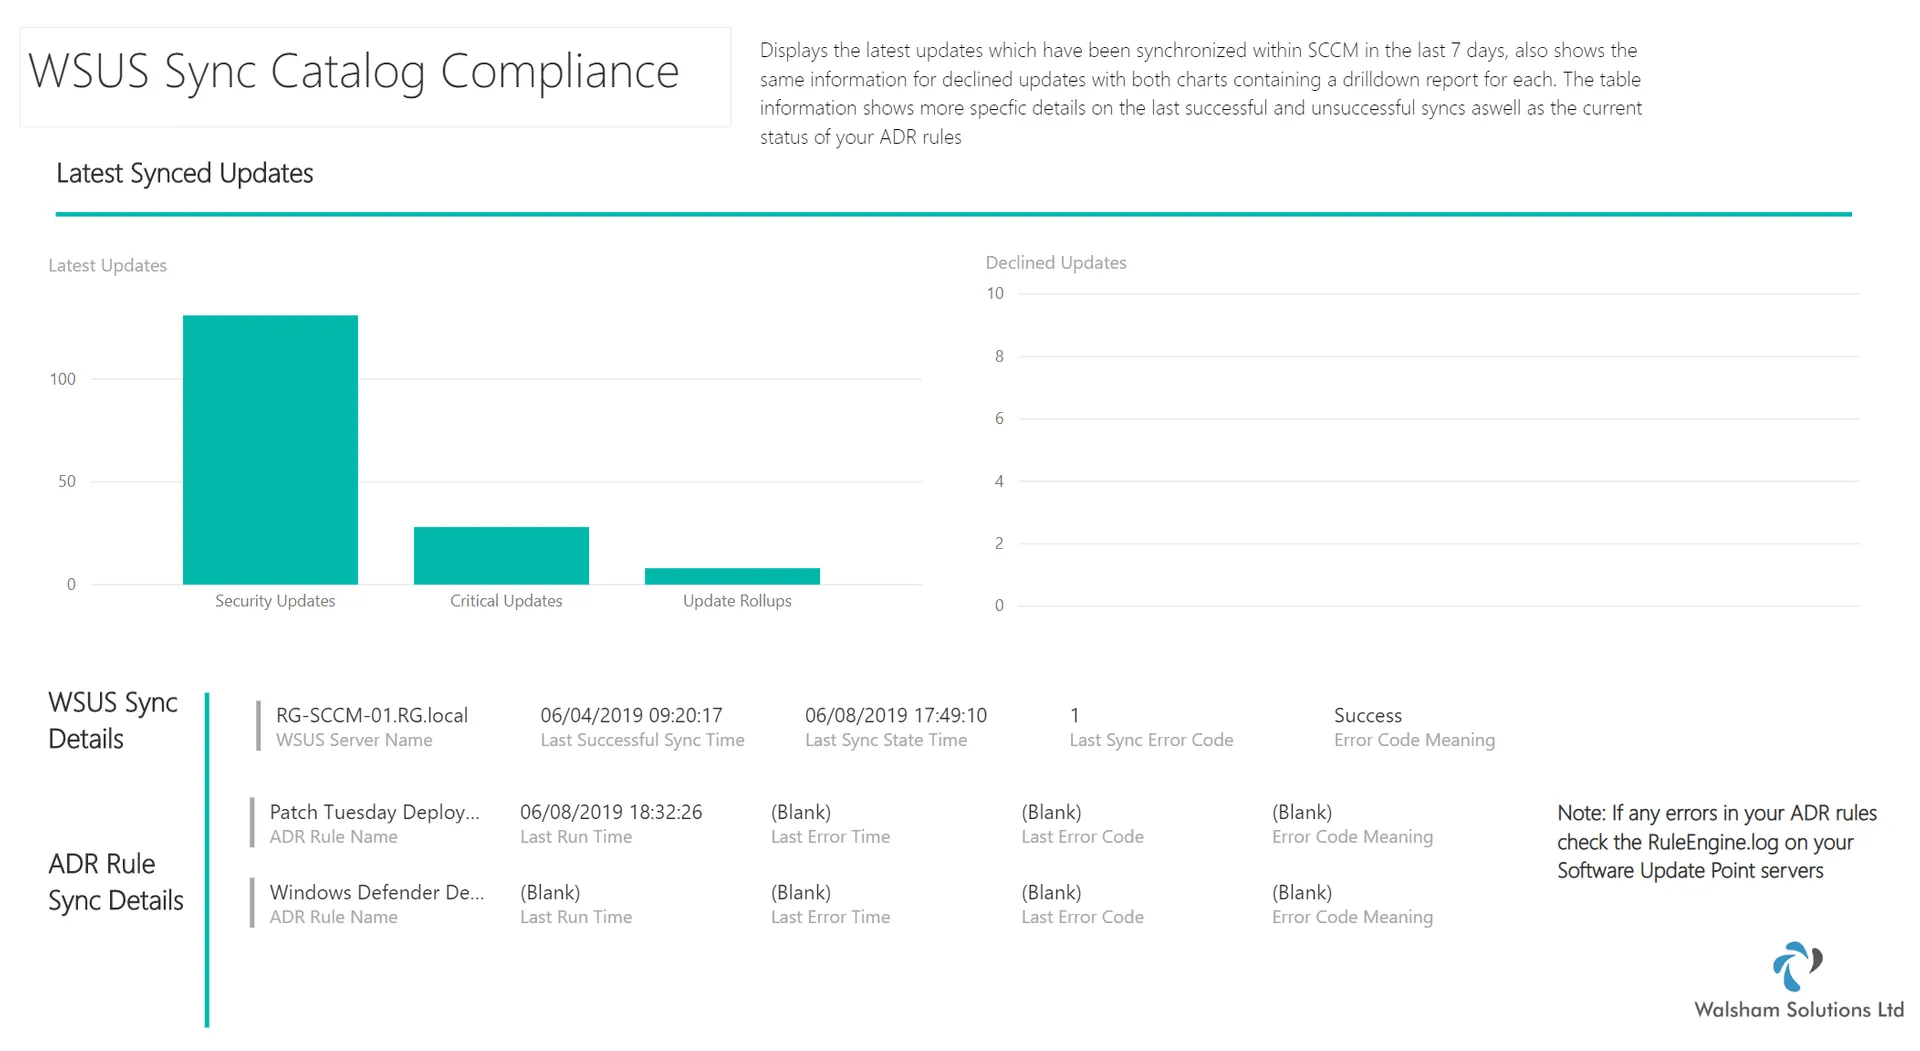
And here is the new and improved version of the page
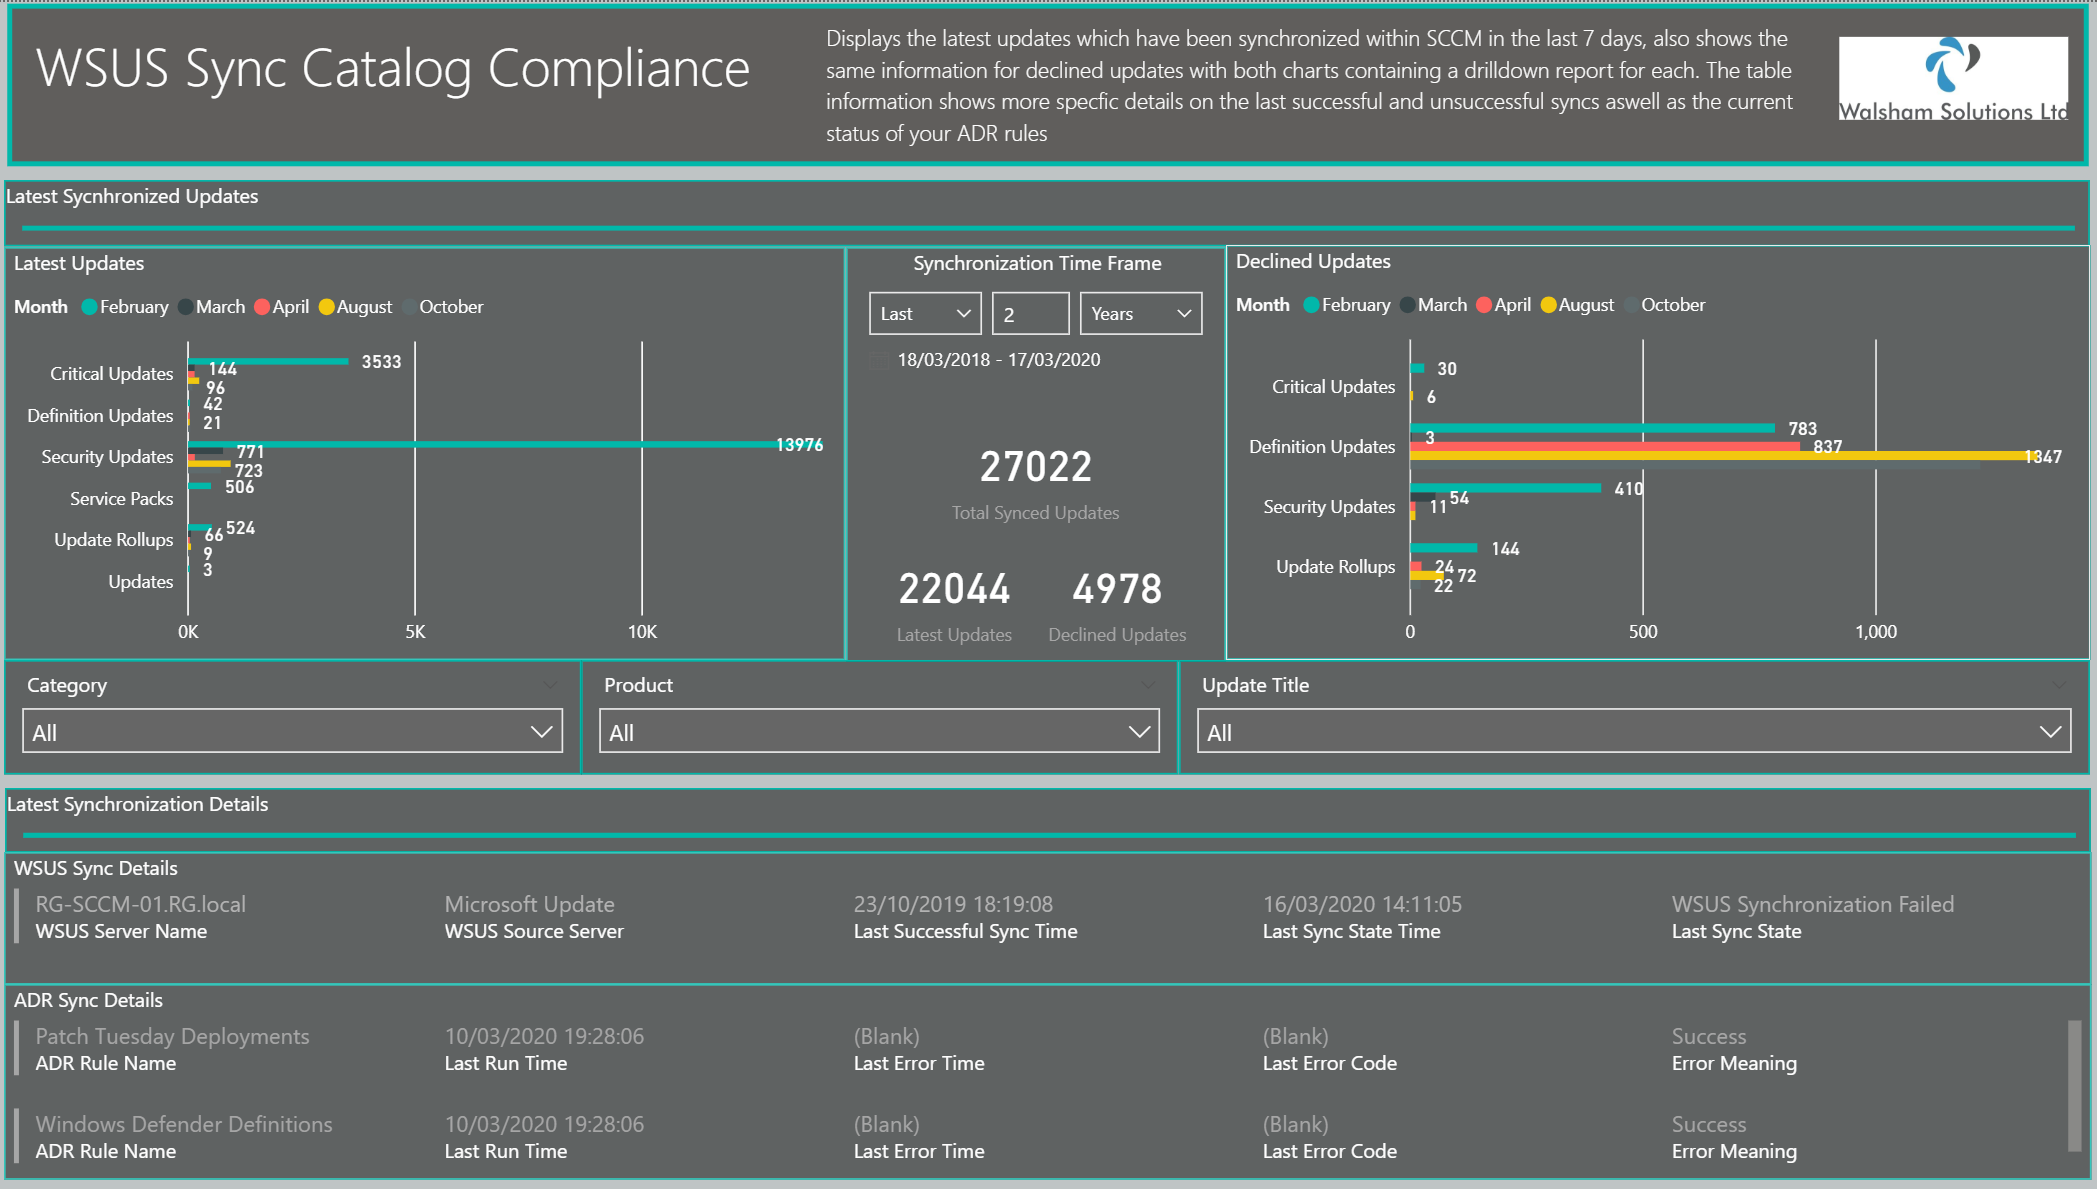
New Features for the pageNew Features for the page
- Revamped breakdown of the synchronized updates - Ability to see not only the update categories, but now will provide a drill-down to the actual products of each category
- Synchronization Time Frame Slicer - Now you can structure the time period in which updates were synchronized from the newest to the oldest with the totals being displayed for updates synchronized in total, and a categorized total of the latest updates and all updates which were declined
- New slicers for better filtering - Slicers added to see specific update categories, specific products which were synchronized and also to locate specific windows update to check if it is declined or not.
- Improved WSUS Error Handling - Status messages provided for when any issues arise with the latest synchronizations.
- Improved see records function - With more enriched information you will see better information when performing any exports of data.
WSUS Cleanup Health State Page
Below is the older version of this page
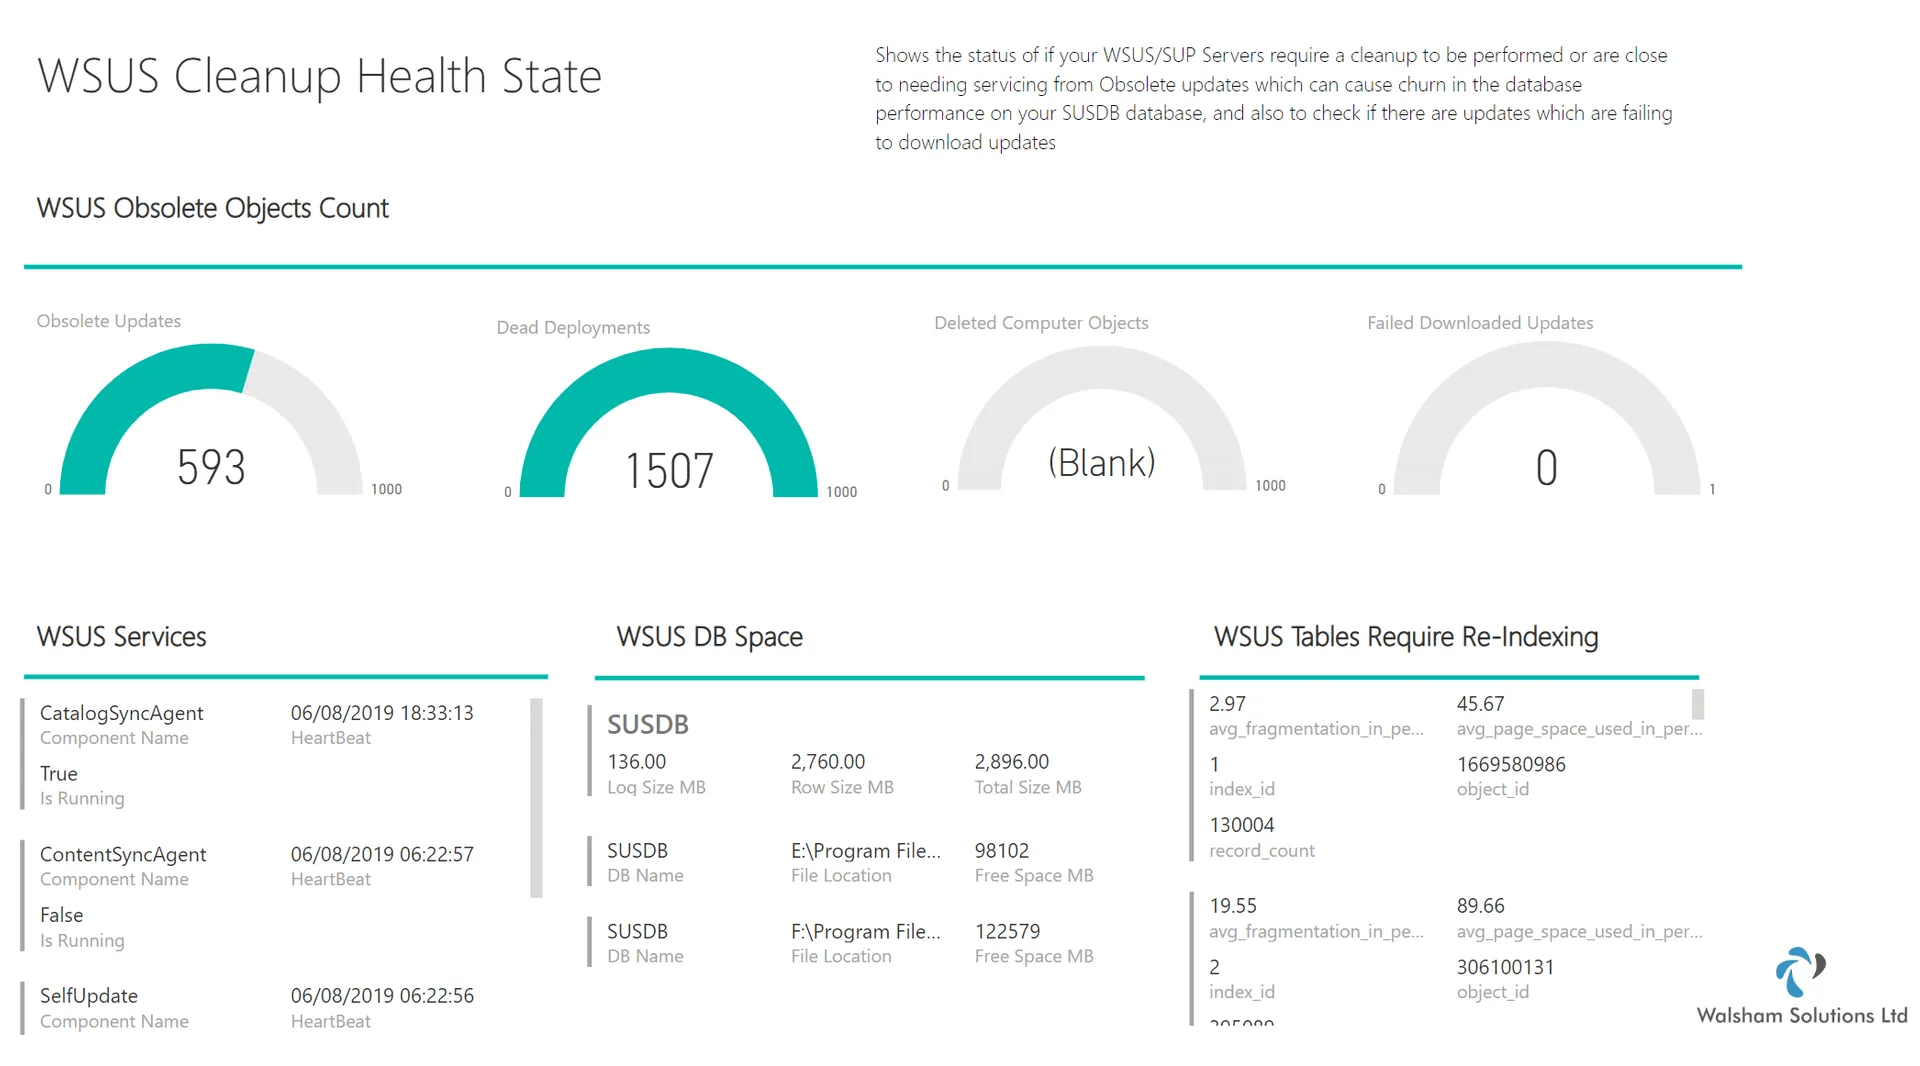
Here is the new improved version of the page
New Features for the page
- Obsolete Objects Donut Chart - Same information displayed for Obsolete Updates, Dead Deployments, Failed downloads and computer objects this time more simpler in one chart detailing the total and percentage of the overall fragmentation of the WSUS environment
- WSUS Services Conditional Formatting Alerts - Here we have the table of all the WSUS services however this time we have conditional formatting enabled to indicate when services are running and not running, which should draw attention to a system administrator if the WSUS service is down.
- WSUS Event History Table - Here newly added is a table which shows the event history so now you can see all status messages with anything being done on WSUS such as when synchronizations start, complete and fail. Great table especially when the Software Update Point (SUP) has triggered a synchronization whether scheduled, manual or via ADR (Automatic Deployment Rule)
- WSUS Legend Tables - Legend tables have been added to explain every attribute in finer detail as well as providing recommendations and links to any more information which can help diagnose or resolve an issue overall.
Software Update Deployment Forecast Page
Below is the older version of the page
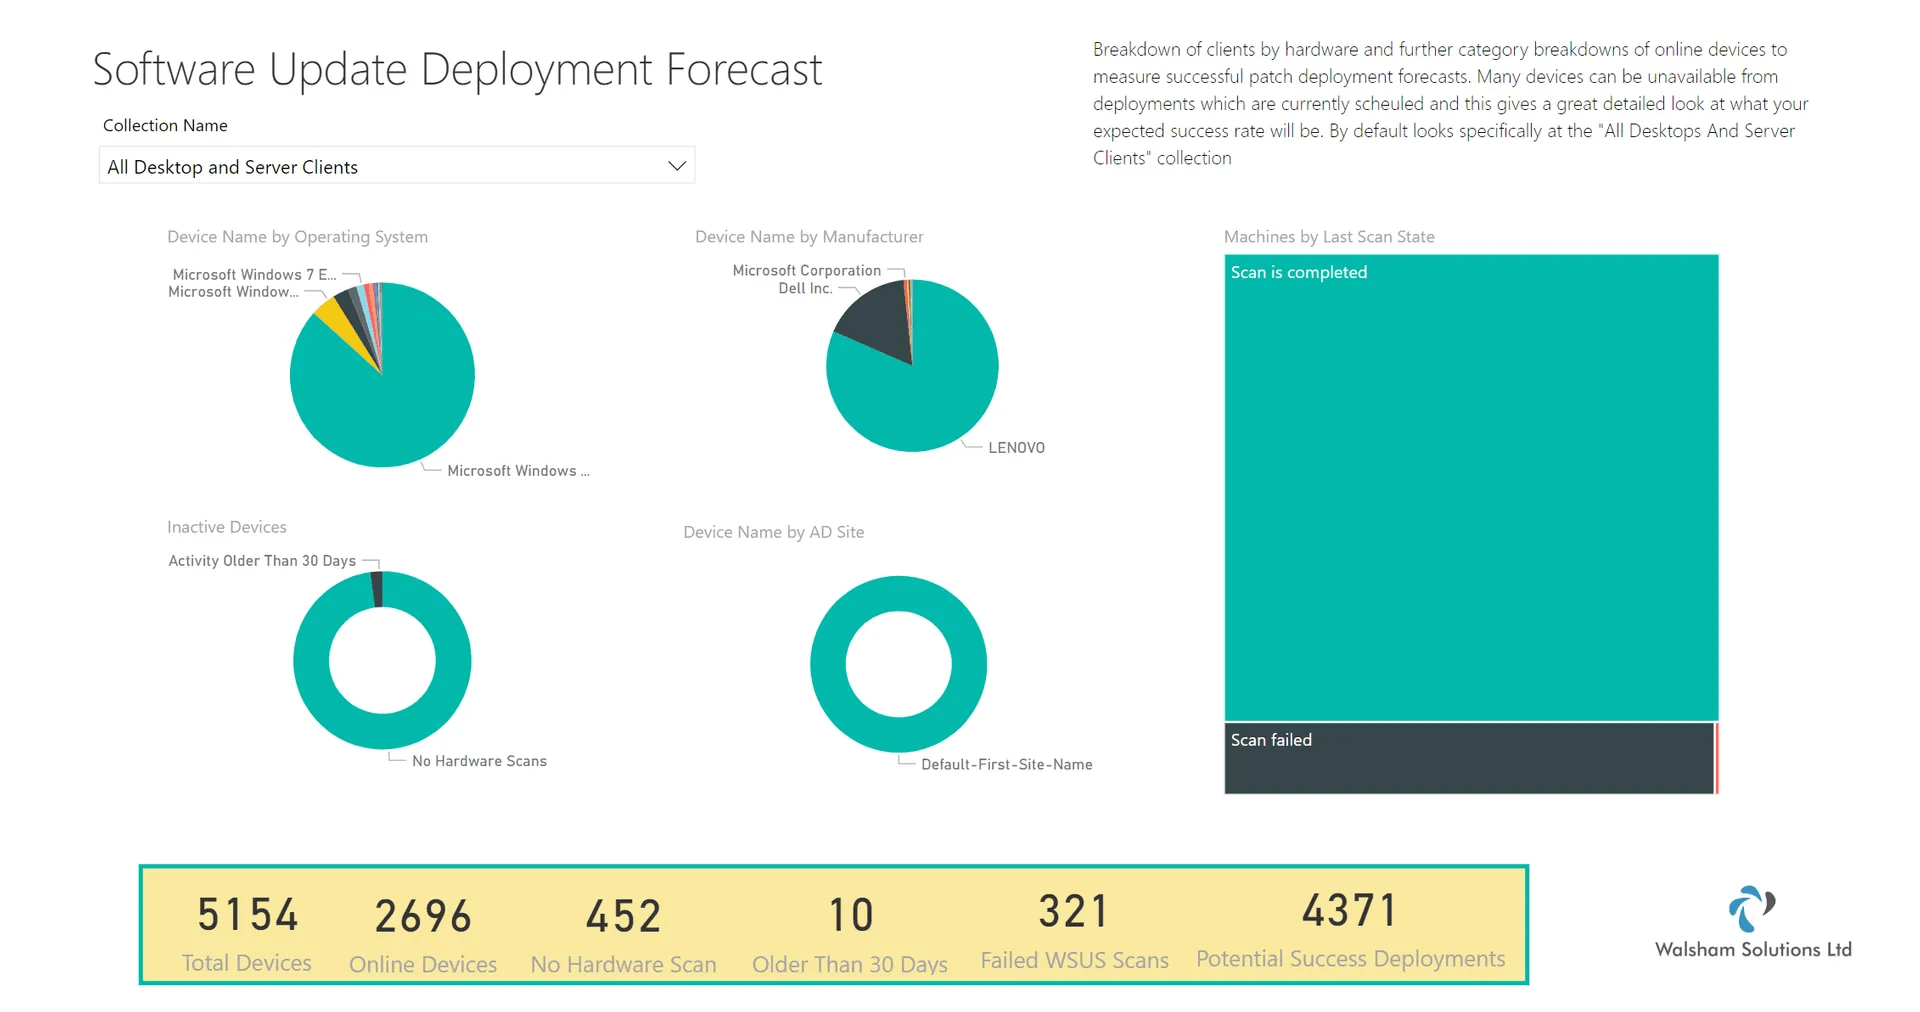
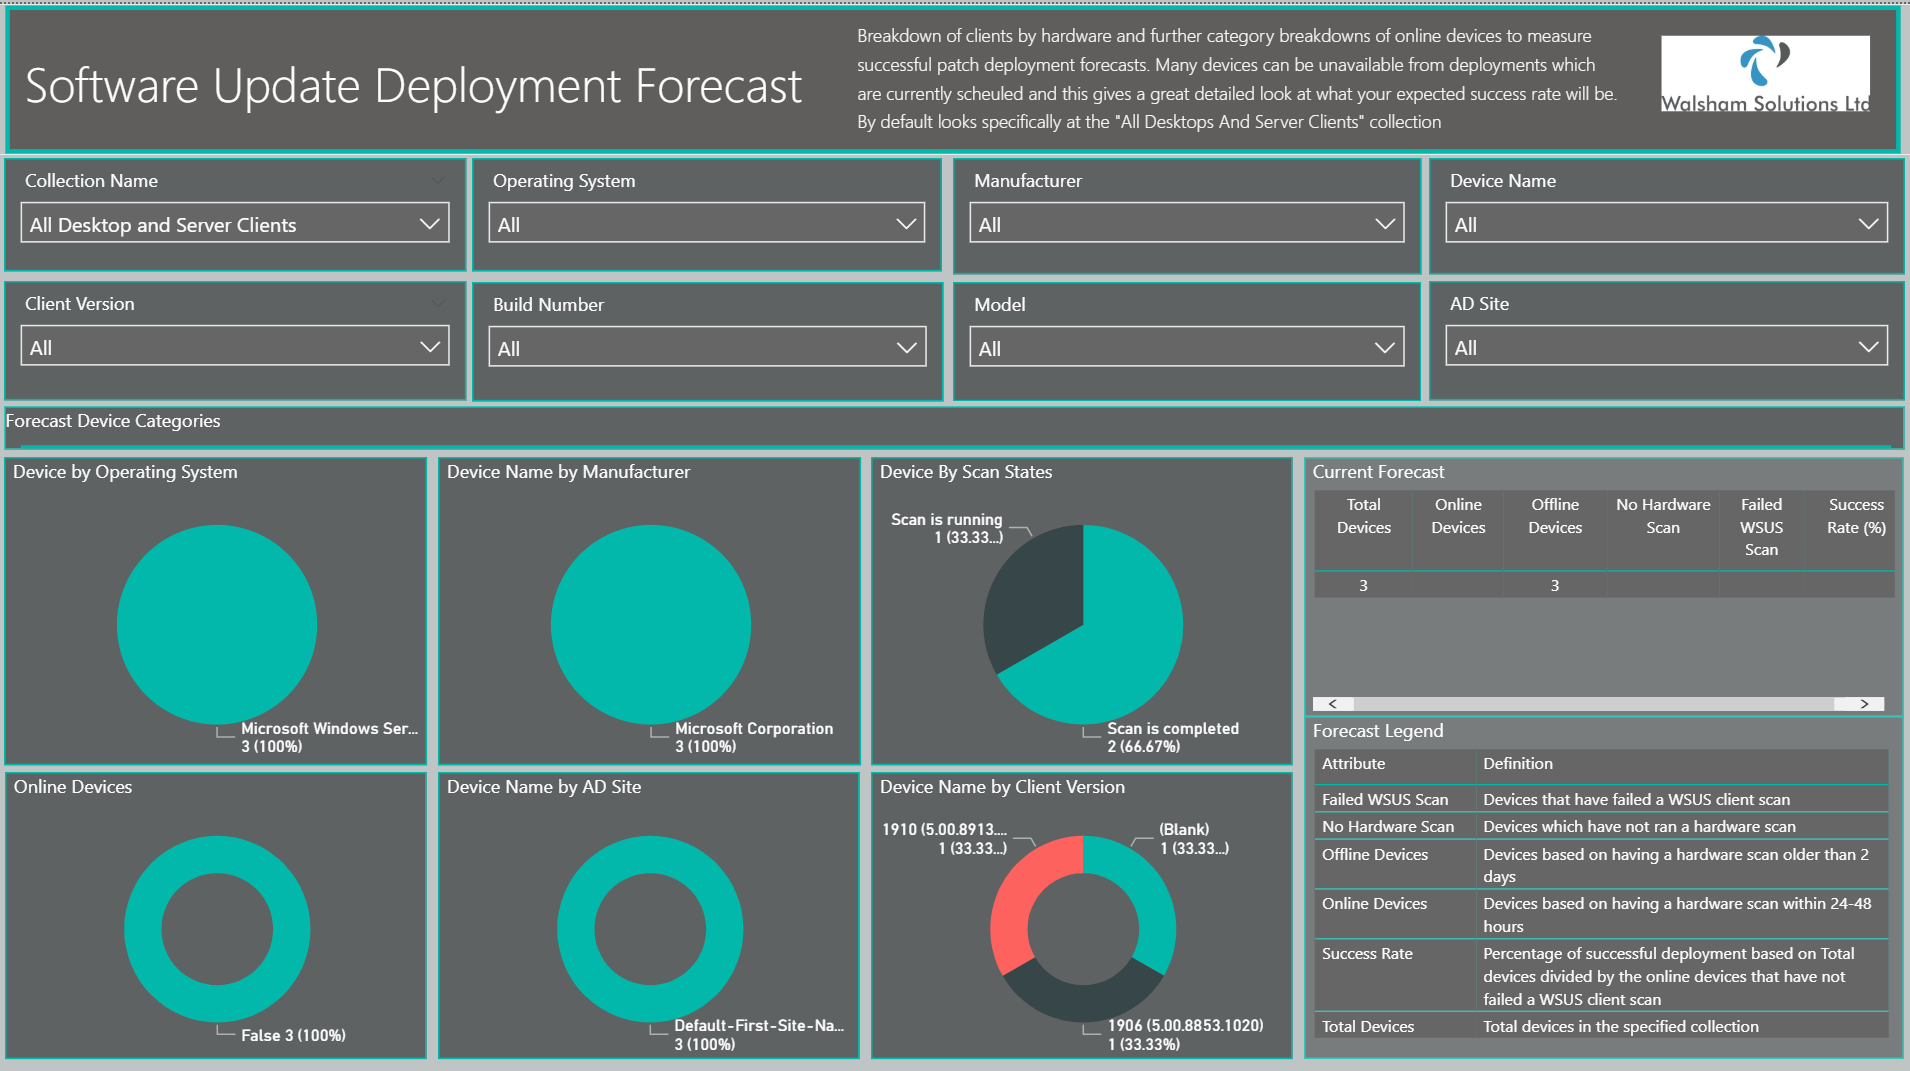
Here is now the new improved version of the page
New Features for the page
- New Improved Forecast Table - The forecast banner is quite an integral piece to this page to provide a summary of what your deployment success rate will be. This has been changed to now represent the overall percentage compared to the total devices of the collection which has been specified. DAX formulas have been used to calculate the success rate being online devices that haven't failed WSUS scans etc
- Forecast Legend Table - The legend table provides a breakdown of each attribute within the forecast table which discusses the definition of each and how they are calculated.
- More Forecast chart visuals - Here is provided more charts to give a wider range of categorical scopes to further analyse the data to see where different device statuses are located which can effectively work positively or negatively to your success rate percentage
- Additional Slicers - Slicers have been added to configure the charts alot better if wanting to zone into more specific information.
- Client Version Informatio n - Every single SCCM client version from the newest to the oldest has been accounted for so if you have a wide mixed range of SCCM clients on different versions we will be able to see this.
- Windows 10 build information - Similar to the client version all Windows 10 build versions from the latest to the oldest have been accounted for.
Windows Defender Definition Updates Compliance
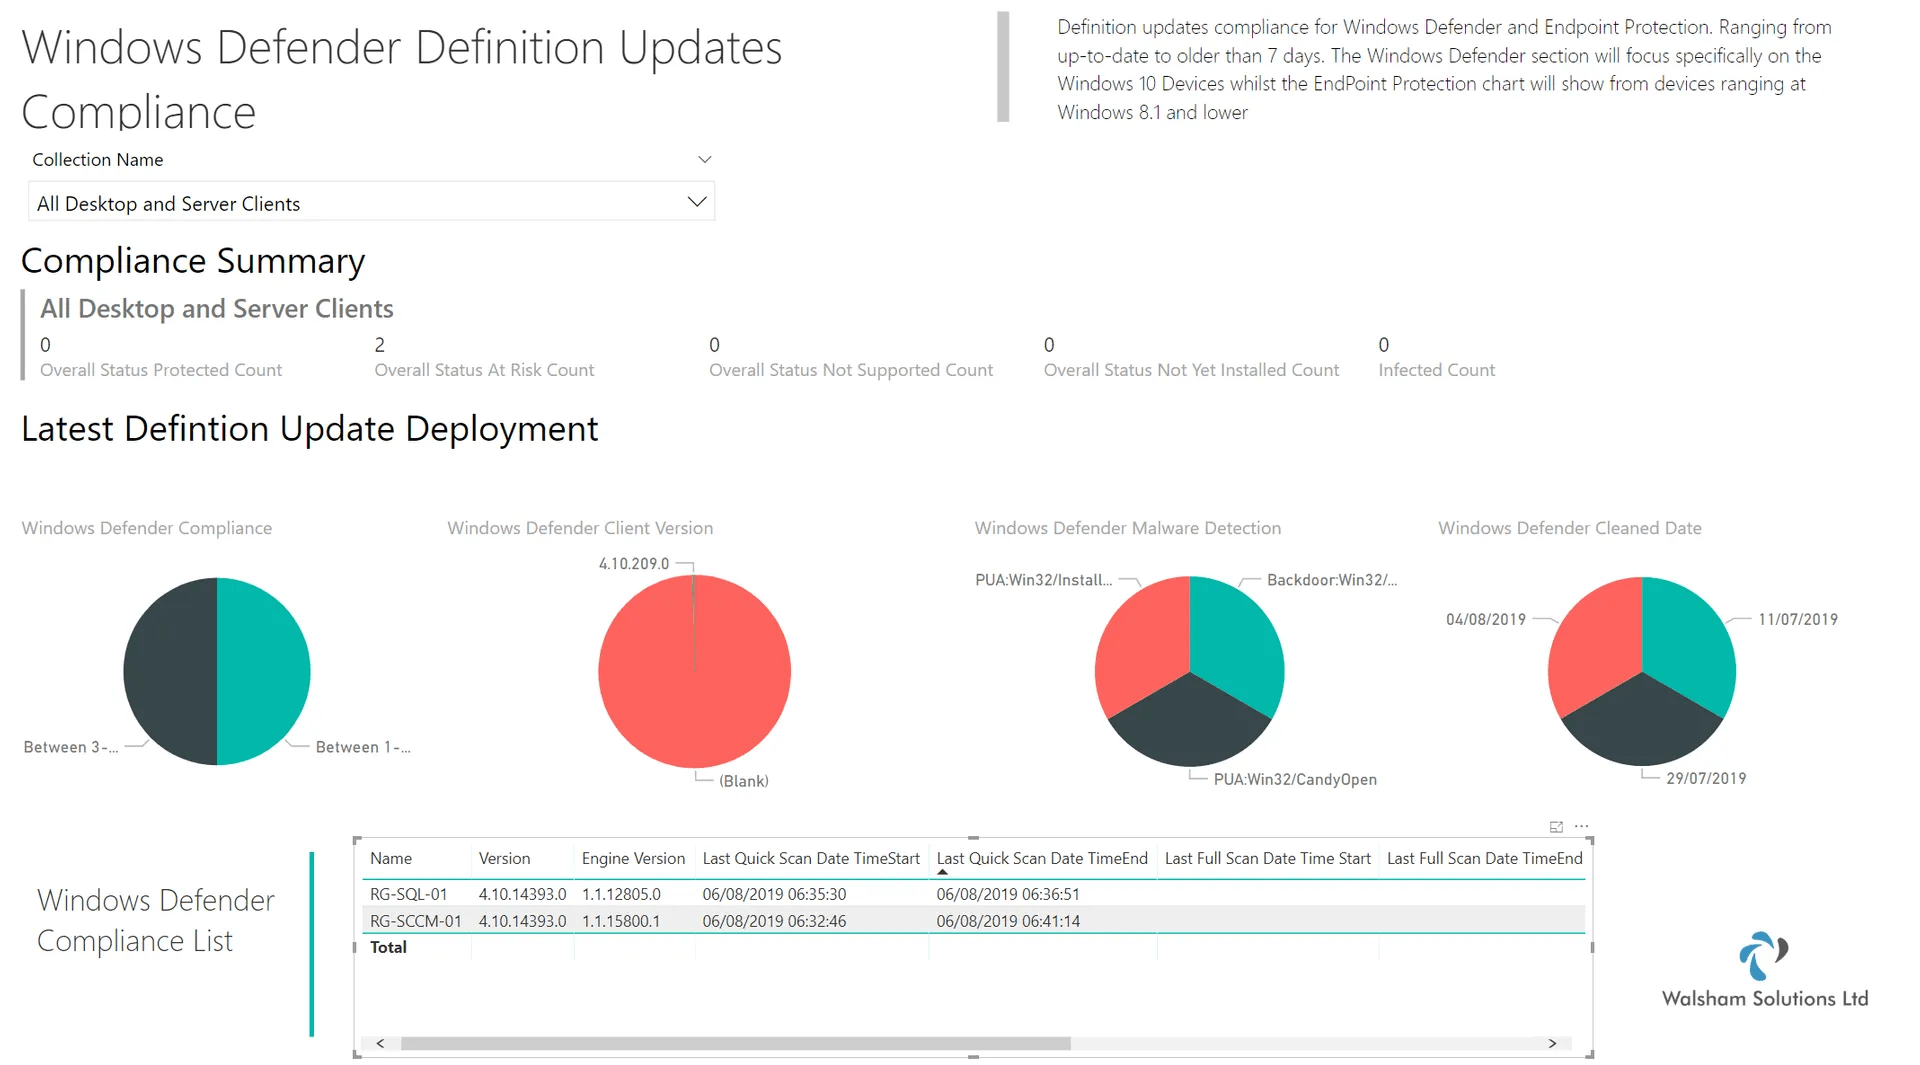
Below is the old version of this page
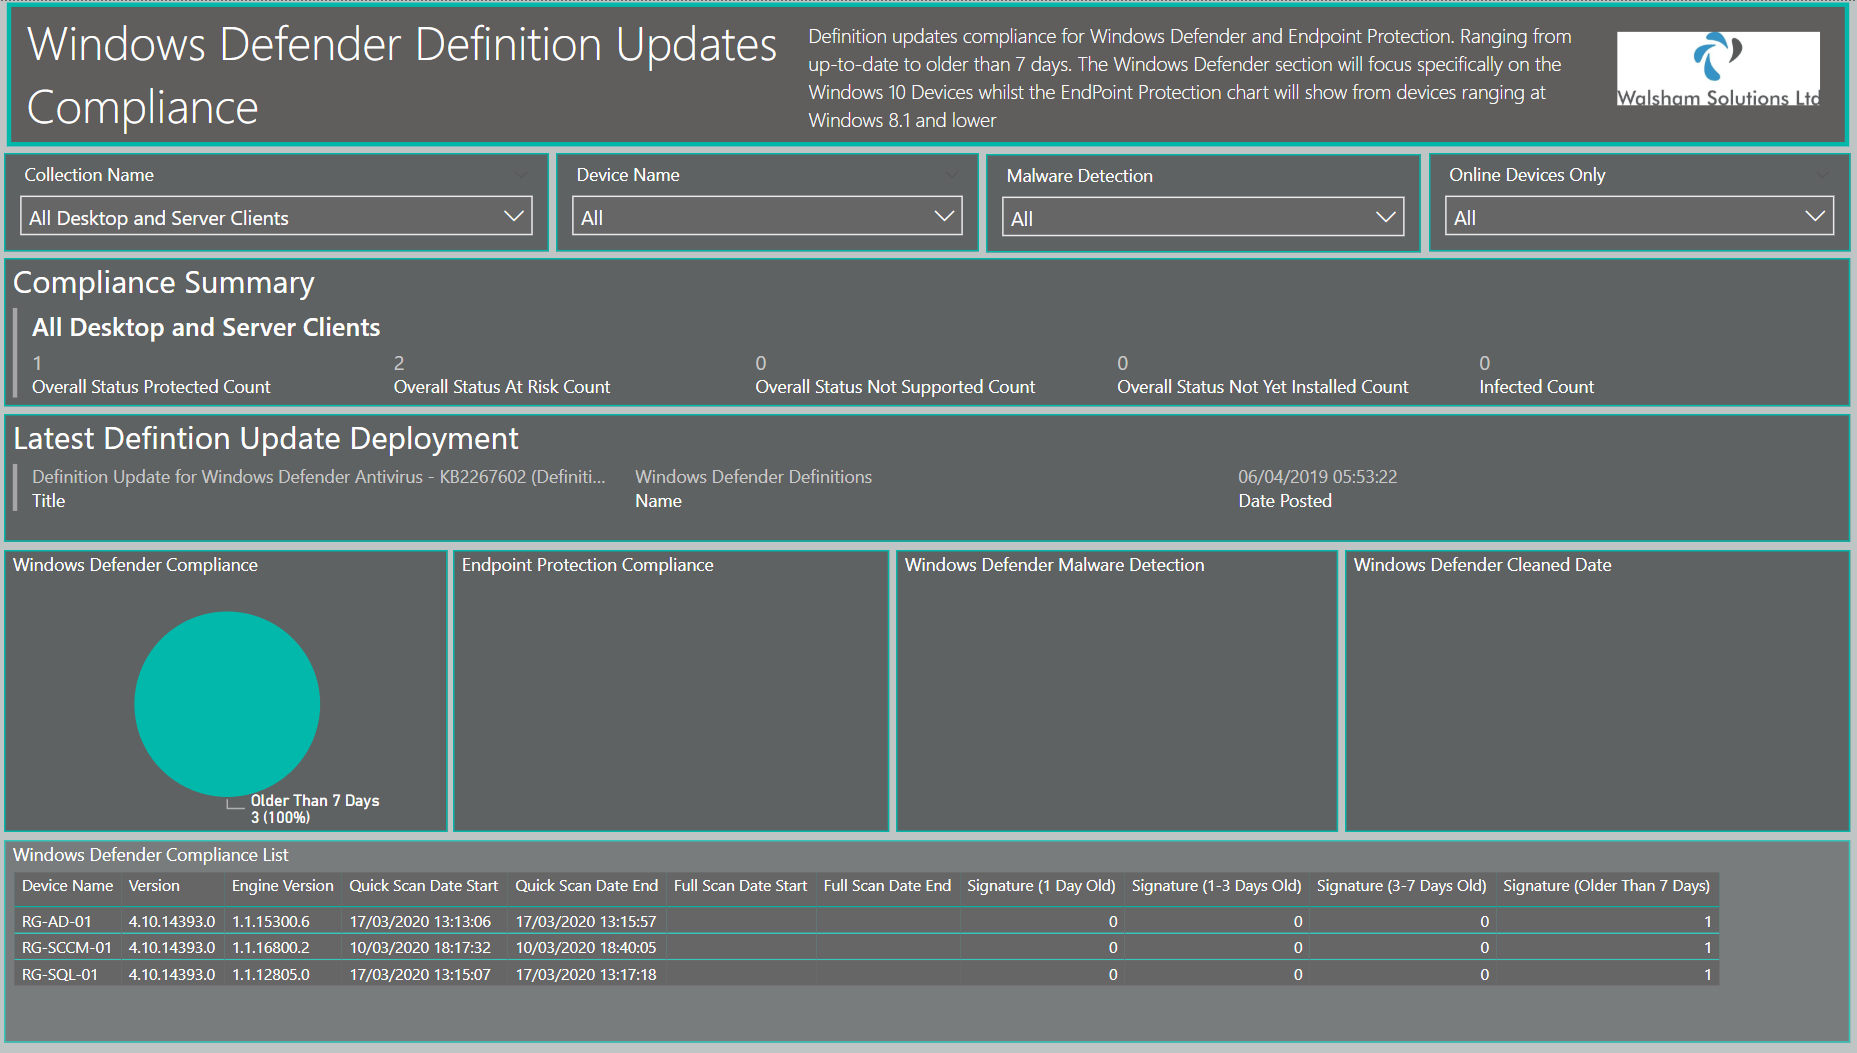
Here is the new version of the page
New features for the page
- Additional slicers for better filtering - Slicers have been added to further customize the experience for the system administrator to drilldown to more specific information regarding definition update compliance
- Display of latest definition updates being deployed - This banner has been advanced so now it will show the latest definition which is currently being deployed to your machines. Note it will only show the latest definition update being deployed as per your ADR rule which is pushing it out
- Recalculated way of checking latest signatures - With their both being a statistics table of signature updates as well as per asset statistic table the pie chart now reflects the table below to give a more accurate drill down as to what machines have the latest definition updates.
- Online Devices only slicer feature - Added a nifty little feature here. Now when we have SLAs to keep to we know that machines that are not contactable for periods of time or offline completely can affect this, so therefore ive created some DAX queries which can filter out any offline machines to narrow done on the online machines.
Current Software Update Deployments Page
Below is the old version of the page
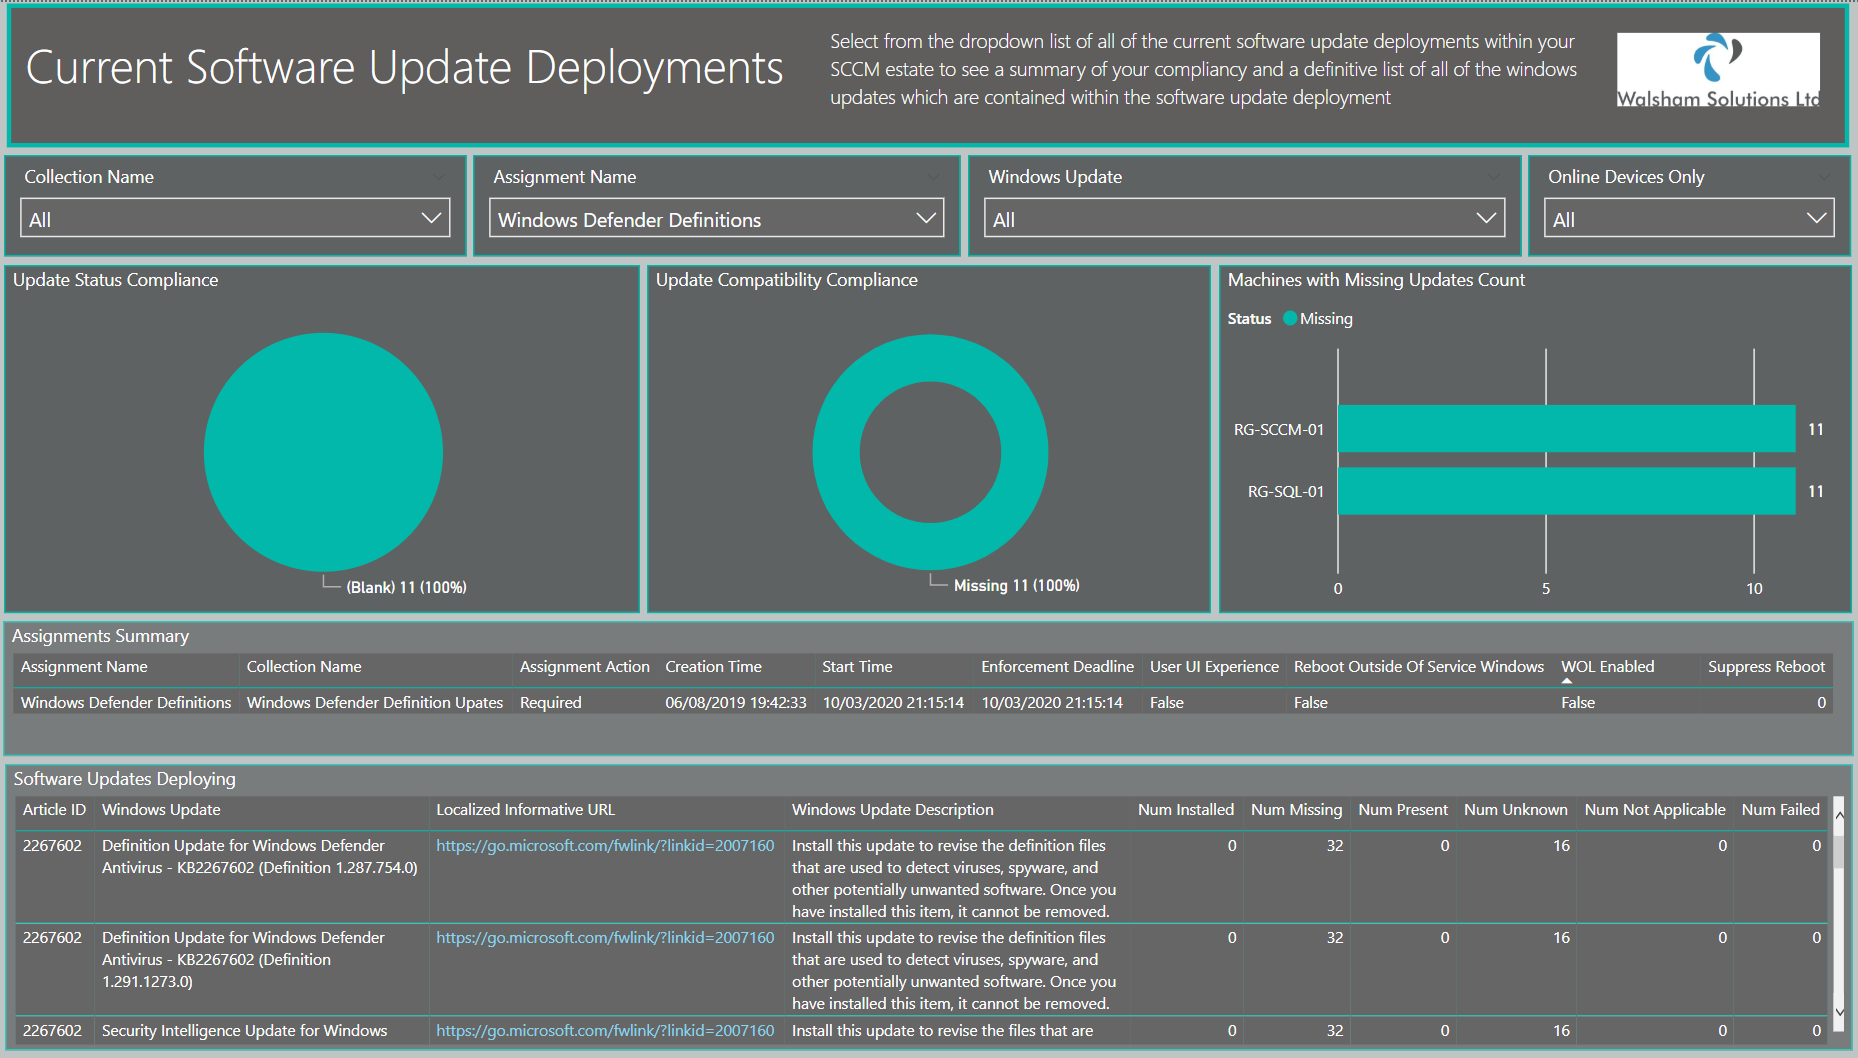
Here is the new version of the page
New features for the page
- Update Status Compliance Visual - Here you can see the status of each update within the assignment and see the compliance status whether they have updates installed, failed, in-progress or even pending a reboot.
- Update Compatibility Visual - Here you can see the compatibility of all the updates applicable to the assignments currently in deployment such as whether they are Installed, Required, Already Present and if they are missing.
- Machines with Missing Updates Count - Each machine which is involved within the collection or assignment deployment will display all of the updates which are currently missing from the machine
- Software Updates Deploying Table - Revamped to display all of the updates involved within that assignment and a statistical breakdown of all of the machines and its compatibility status count
- Additional Slicers - Slicers added to customize the collection view and also if wanting to search for a specific update.
- Online Devices only slicer feature
- Added a nifty little feature here. Now when we have SLAs to keep to we know that machines that are not contactable for periods of time or offline completely can affect this, so therefore ive created some DAX queries which can filter out any offline machines to narrow done on the online machines.
Sofwtare Update and Device Compliance
Below is the old version of the page
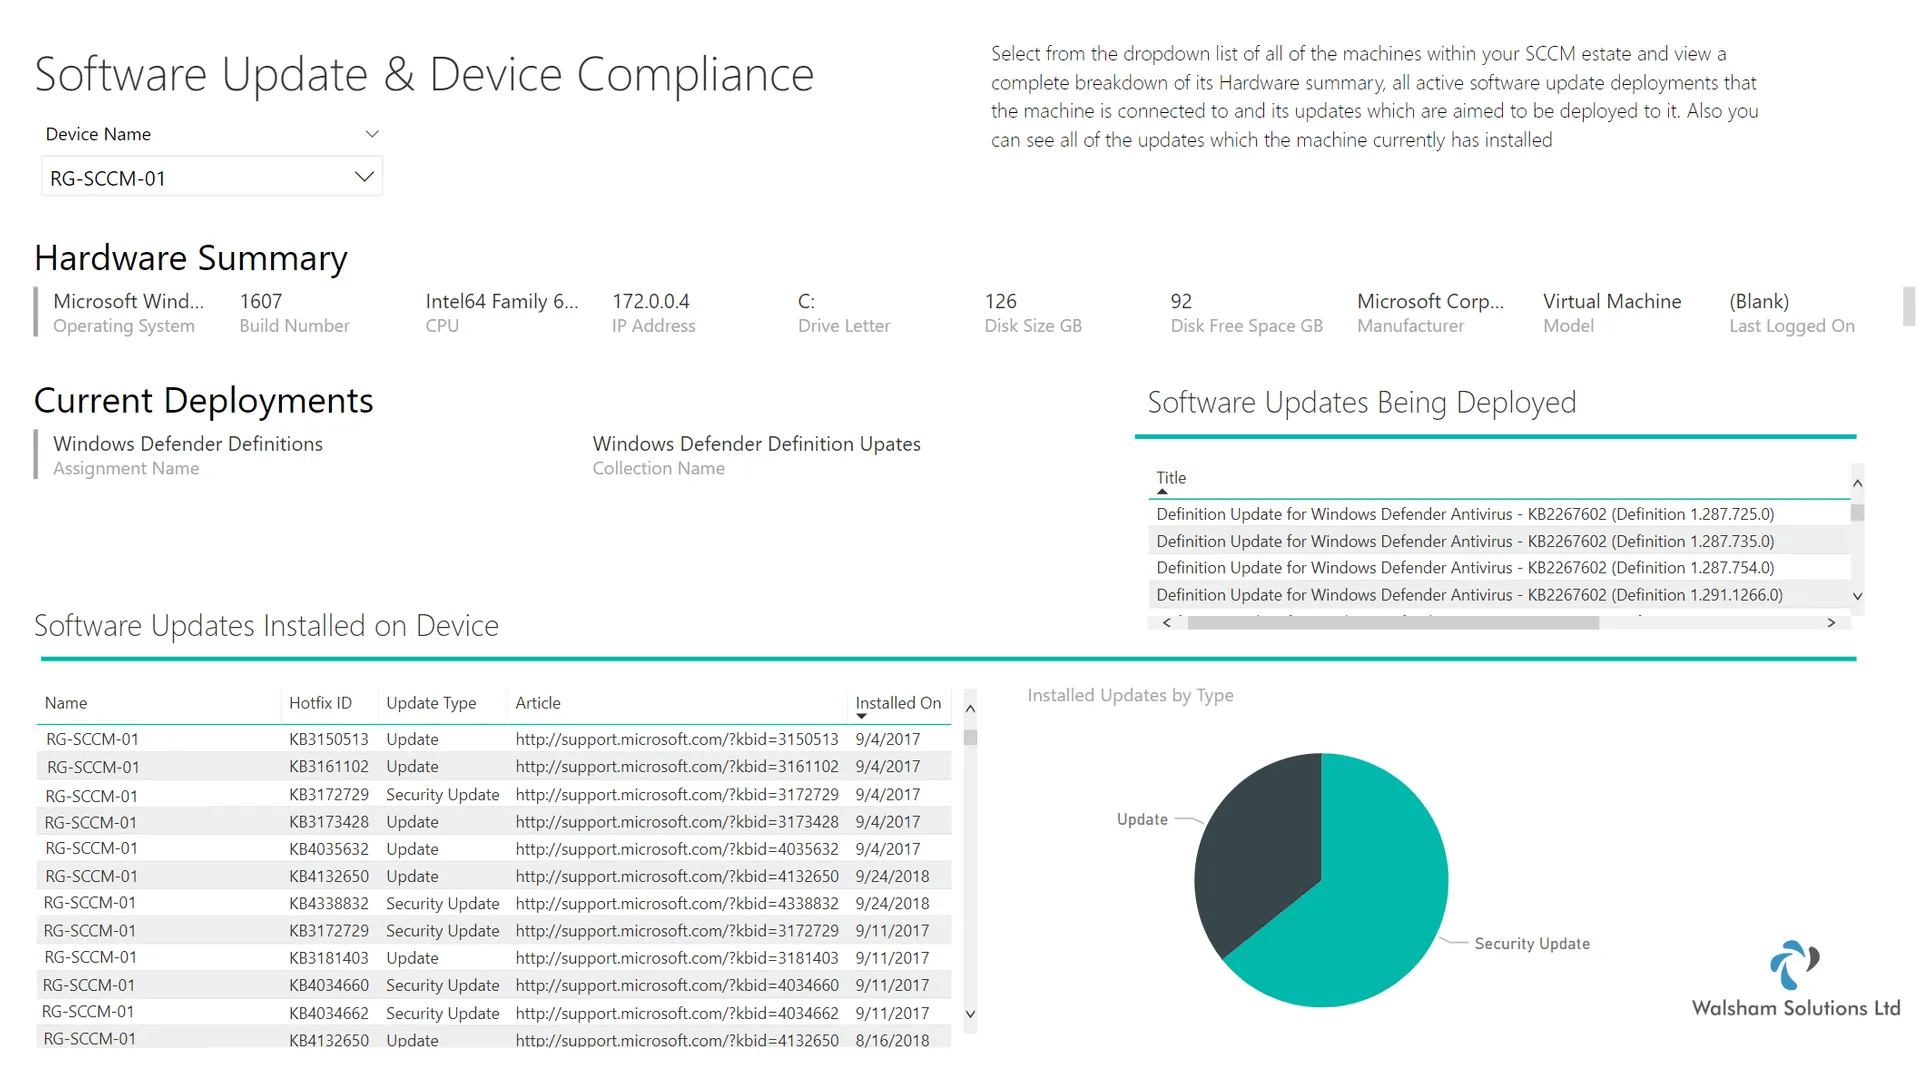
Here is the new version of the page
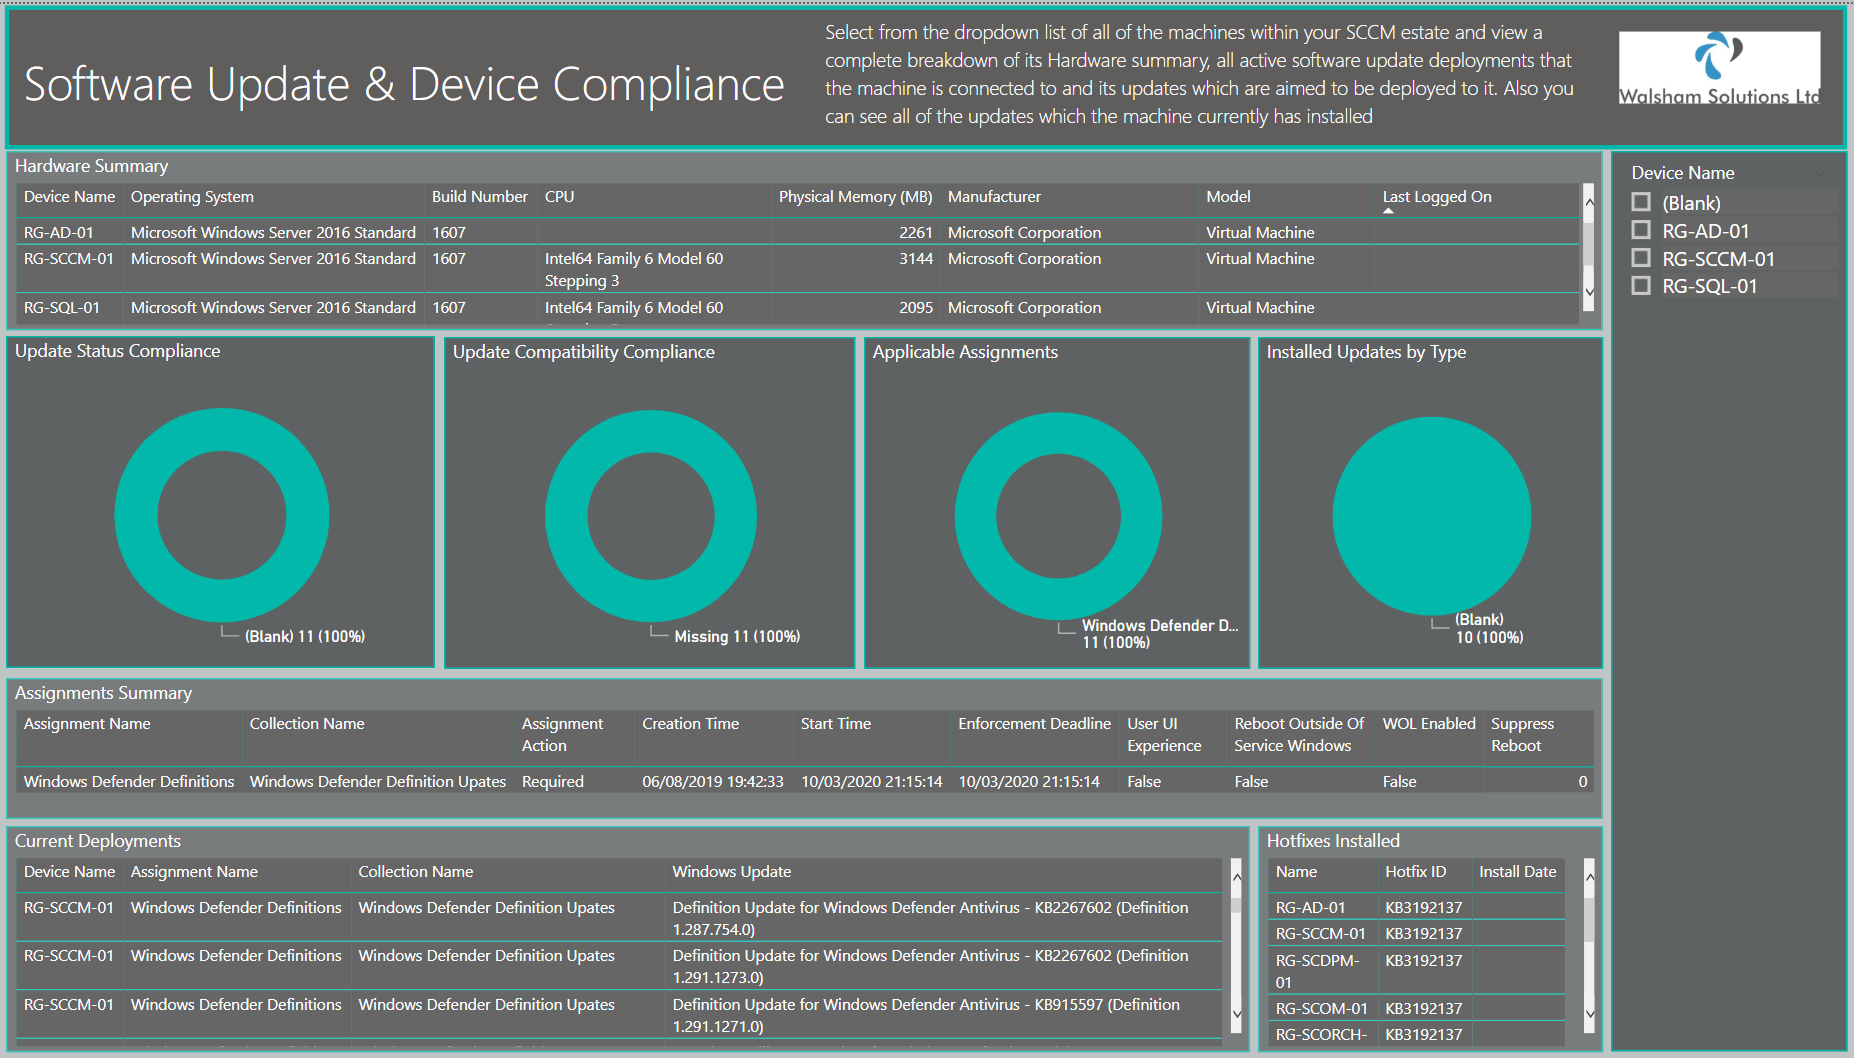
New features for the page
Troubleshooting
Timeout Issues
If experiencing any issues in regards to queries timing out then ensure you edit the query and enter a time frame which is suitable for your command timeout properties to ensure it runs correctly
- Open External Data - Edit Queries
- Go to the query on the right hand pane select the wheel icon where it says source
- Enter the Command timeout properties then click OK
- Then in the top right hand corner select Apply and Close
Online/Offline Devices Setting
This is currently controlled by a DAX query column called "HWOlderThan2Days", if you wish to change the value to something different to decide how you determine online/offline devices to the following;
(Note: The following queries "CurrentlyOnlineMachines" and "ClientSummary" datasets have this configuration)
- Go to either dataset listed above on the right hand side
- Dropdown the columns and double click the "HWOlderThanXDays" column
- You should then see the formula dropdown, change the value from from "2" to another value (you can also change the name of the column too which is before the "=" sign
- Click the tick sign to approve this