
Modern Workplace Management - Endpoint Analytics
Managed Windows 10 Device analysis reporting for compliance

Introduction
When managing your estate through Modern Workplace management, specifically with Windows 10 Devices we want to try and gather as much data as possible, especially when it comes to the reporting of significant data in which we can understand all of the performance of our managed windows 10 estate.
The best way to get control and take advantage of this is the utilisation of Endpoint Analytics.
Endpoint Analytics gives the Intune administrator the ability to collect data from your Windows 10 devices such as;
·Start-up Configuration
·Recommended Software for devices
·Proactive Remediation
Endpoint analytics is somewhat similar to how you would have seen desktop analytics which is more specific to on-premise devices as opposed to where Endpoint Analytics is more driven towards Intune/Co-Management type of scenarios.
Before we get into the configuration of Endpoint analytics
lets look into each section closer and see how it looks at a Windows 10 device
managed within Intune.
Start-Up Configuration
The start-up configuration data shows deeper analysis on a managed device around the following categories;
·Average Start-up Time (Seconds)
·Boot History
·Sign-in History
·OS Restart History
Here is an example of how this data is visualized when captured from a Windows 10 Device. Below is a start-up score which is measured on a baseline which can be configured and measured against other baselines to ensure that all of your devices are aligned with the best compliance results.
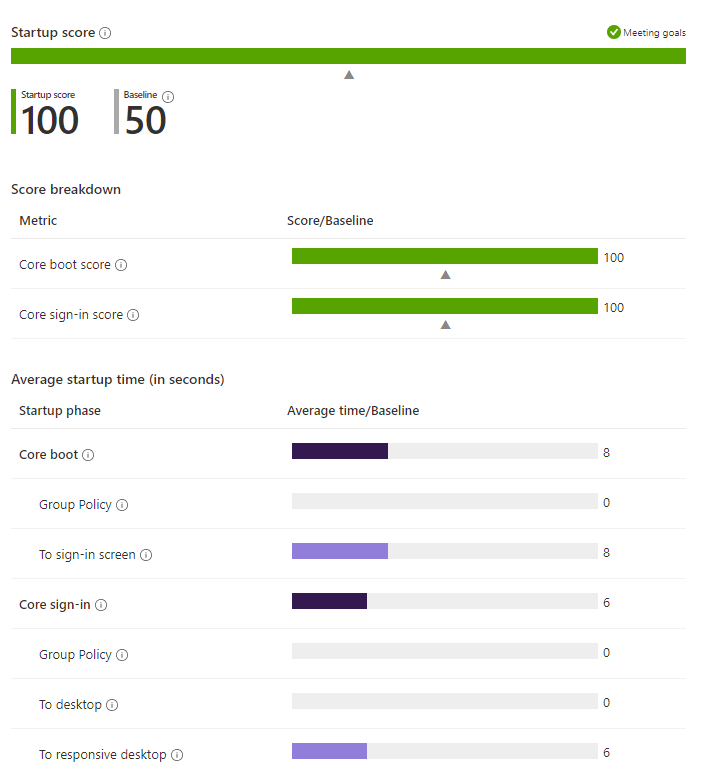
Another window which shows even more detailed analysis can be seen below when browsing to your managed asset, which are focused more around the boot history detailing a breakdown of the duration as well as what kind of events had caused them.
Also another chart is one based around the sign-in history of your endpoint.
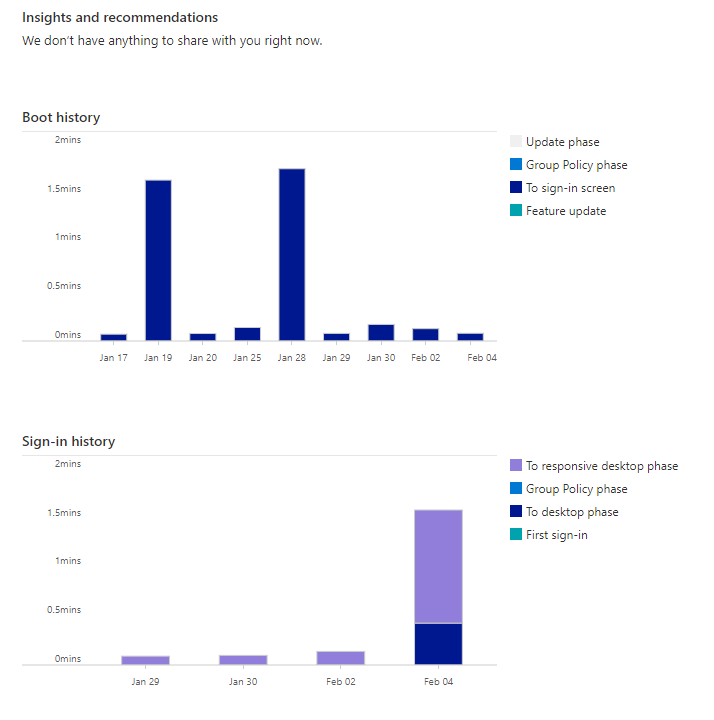
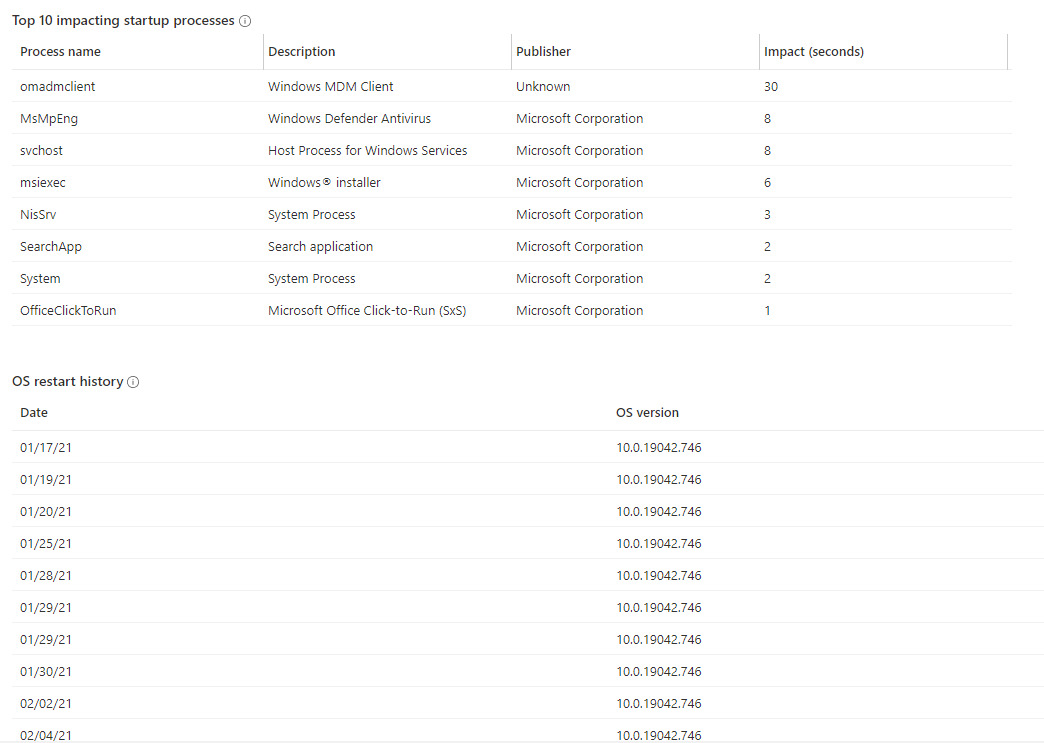
In addition you also get to look into the start-up processes which can also impact the following events above by displaying a top 10 and OS restart history.
Recommended Software
The recommended Software section shows a summary chart of all of the devices which meet the requirements to be managed within Modern Workplace Management and is categorised for how many meet them such as;
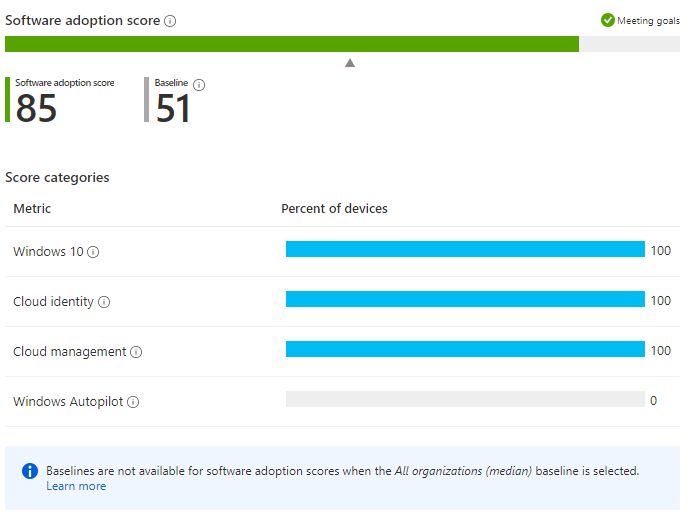
Each bar represents how many are running Windows 10, Azure AD Domain Joined and enrolled.
The bar below is for devices which have been enrolled through the Windows Autopilot where currently there are no devices enrolled currently.
Proactive Remediation
This to me is a very exciting feature (will have more articles around this soon) in where we can deploy remediation scripts and fix any issues on demand or even on schedule.
Now if you are familiar with both Configuration Baselines as well as script packages within SCCM/MEMCM then you will have a good idea on how these work as they have a combination of both worlds where you need both a detection and remediation script.
If we look at a couple of example proactive remediation packages below;
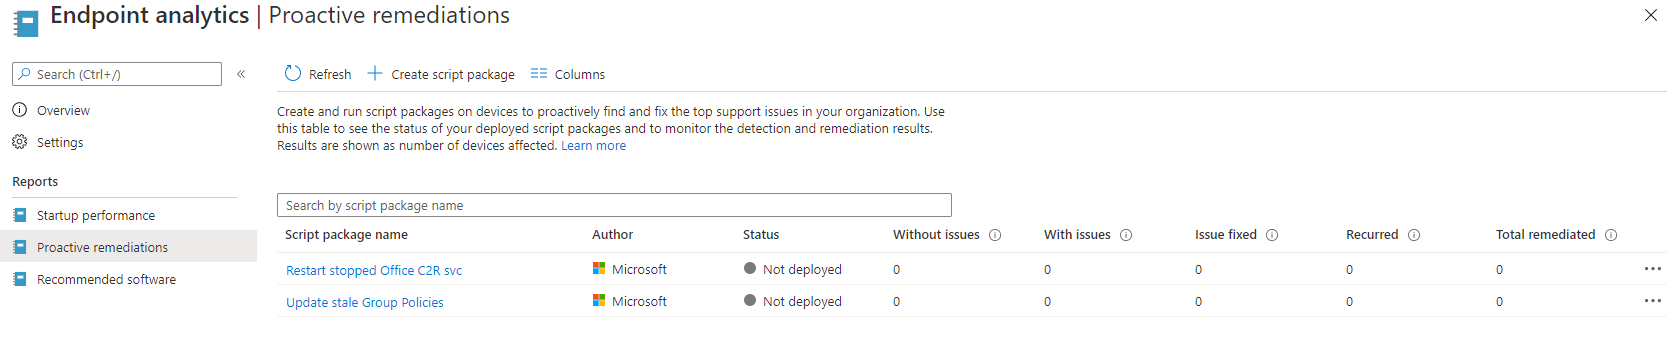
One specific one we can concentrate on is the "Update stale group policy" which is a very handy one for when devices have GPOs which may have not kicked in or applied, and these can sometimes cause issues especially when working with SCCM if certain GPOs play a vital role in your infrastructure (will cover GPO Management in Intune at a later time)
I have various ideas in which type of remediation scripts can certainly be of help, for example kicking off hardware inventory runs if running a co-managed environment where certain devices maybe more offline than usual all the way up to controlling third party updates for various vendors (another which I will cover in a later article)
How to Setup Endpoint Analytics
The enabling of Endpoint Analytics is quite simple, all you need to do is the following;
- Log into your Device Management console
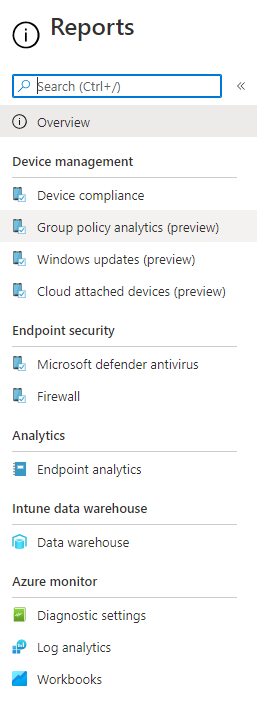
- Go to Reports
- Go to Endpoint Analytics as per Figure 1.1
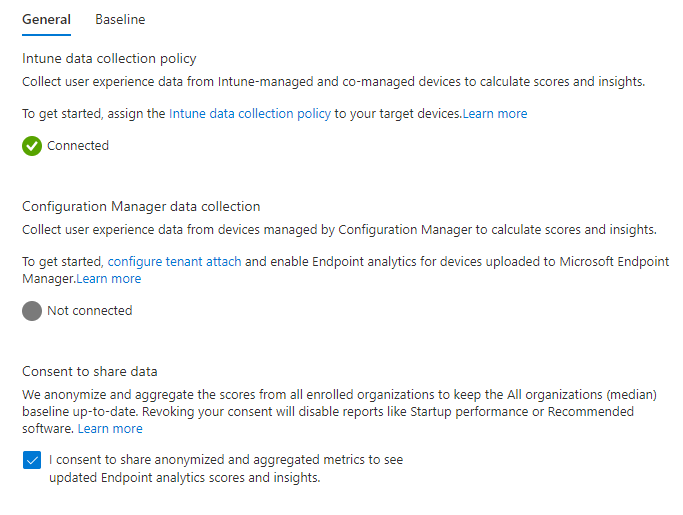
- Go to Settings
- Click the "Intune data collection policy"
- OPTIONAL - Click the "Configuration Manager data collection" if you are using a co-managed setup.
Endpoint Analytics Baseline Configuration
Earlier we spoke about baselines and how they work in terms of the comparison of other scores on specific reports. Well we can create various baselines by doing the following;
- Log into your Device Management console
- Go to Reports
- Go to Endpoint Analytics as per Figure 1.1
- Go to Settings
- Go to the Baseline tab

Baselines are great where we can set a measurement on what targets we want our score reports to achieve on a regular basis in order to maintain a certain standard.
So when you click "Create new" and give your baseline a name it will then register the current score of all of the categories which we had mentioned earlier. And for good measure we can also alter the baseline regression threshold which allows us to state how much percentage we will allow the score to go under and still be in line in order to measure realistic expectations.
So now when we go to a page to view the latest analytics you will now see this.
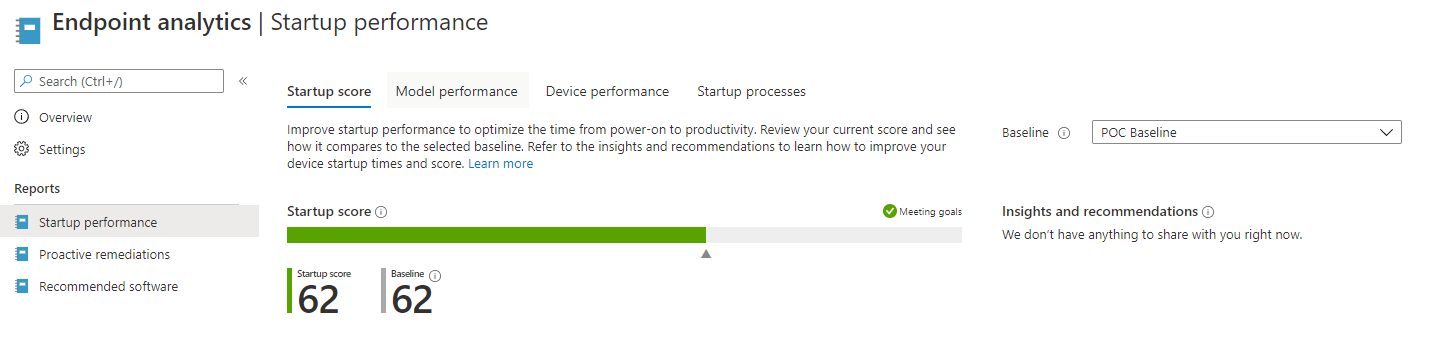
Now you can see there is now a comparison score which makes more sense to the administrator so that you can see how the scores tally up, in this case it is like for like.