
System Center Operations Manager Compliance Dashboard
In-depth look of your monitoring estate in PowerBI real-time!
Introduction
This requirement and solution was formulated over a long period of time in which we may have been tasked to provide a lot of information regarding current monitoring as well as historical monitoring, which can range from various sectors whether more locked down for security purposes or utilising a centralized solution to provide a single pane of glass view into the health of the current estate.
Here we present the System Center Operations Manager dashboard - could have thought of perhaps a more fancier name but as it serves as an all purpose dashboard the name seems to stick.
Why not use the HTML5 Dashboard in SCOM Web Console
There are various widgets in which the same information can be provided in some of the pages in the dashboard, the reason being to separate from the web console was so that we have a source in which for resiliency where if for whatever reason SCOM (primarily the databases) are non-contactable, with the most recent refresh we would still be able to maintain somewhat current as well as historical data.
We may also find a lot of information requested specifically in report format tend to be off the cuff requests, whilst SCOM is a very powerful tool it does require customisation to fit the needs of the requester or organisation. So this dashboard is targeted to provide a standardised answer across many frequent requests
Where to Download
This dashboard can be downloaded from Technet Gallery from the following URL link
https://irp-cdn.multiscreensite.com/c1f89e50/files/uploaded/SCOM%20Compliance%20Dasboard.zip
Dashboard Pages
Front Page
The front page being primarily an introduction page and providing a table of contents, each with providing a brief summary of what each specific report covers.
All text boxes also contain an interactive button which allows you to click and will automatically take you to the desired report page within the dashboard.
Operations Manager Health Compliance
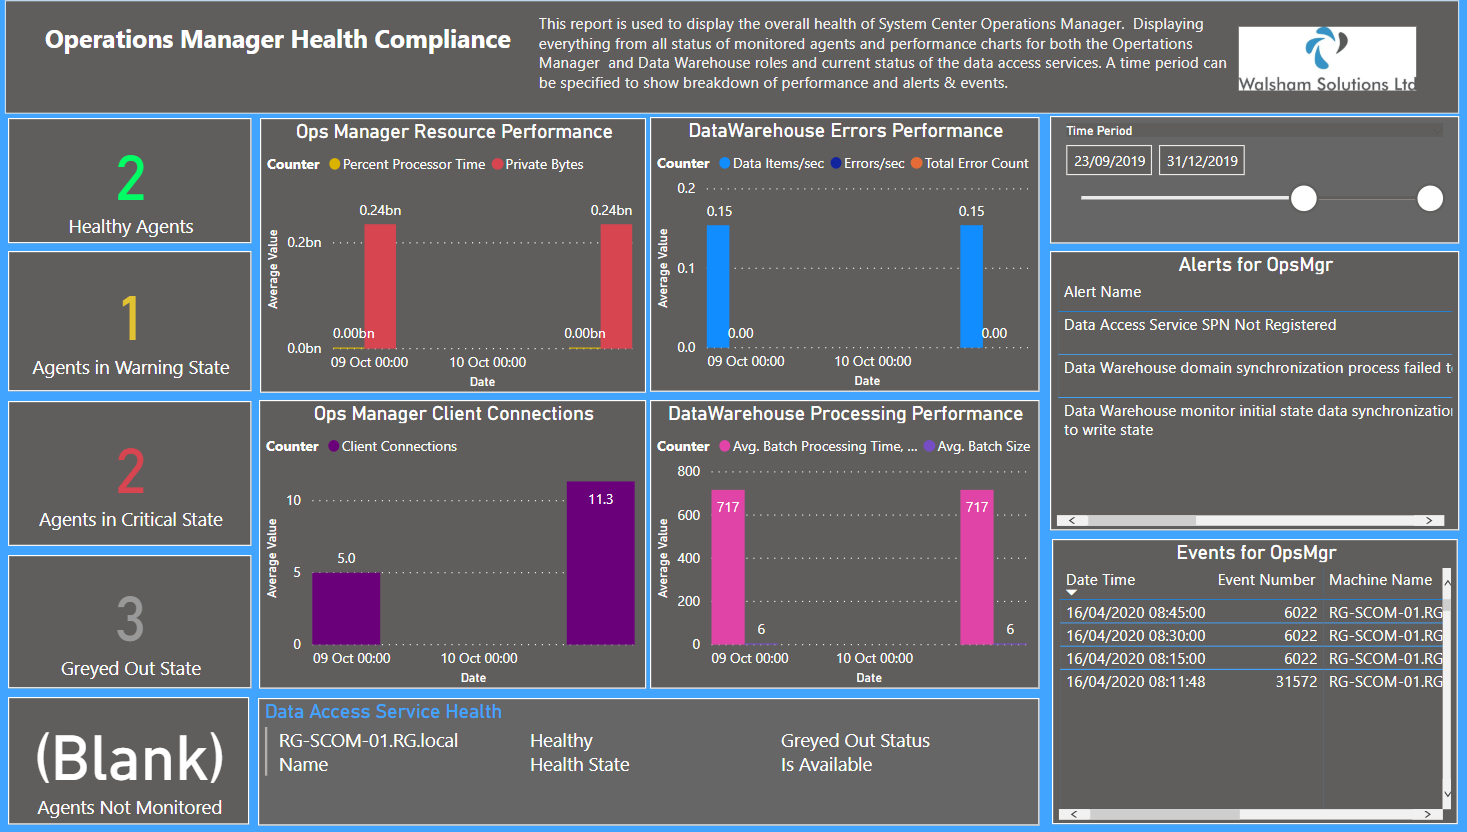
To kick things off we have the Operations Manager Health Compliance which is essentially a SPOG (Single Pane of Glass) look into the overall health of your SCOM Architecture.
We can see the following statistics on the left of a count of managed SCOM Agents;
- Healthy Agents
- Agents in Warning State
- Agents in Critical State
- Greyed out State
- Agents Not Monitored
In addition there able tables on the right which show any alerts which are specific to the SCOM architecture as well as the latest event logs which come from them.
Below is a table which shows the health state of the Data Access Service in case there are any issues with SCOM where you are unable to access it.
Monitoring Compliance
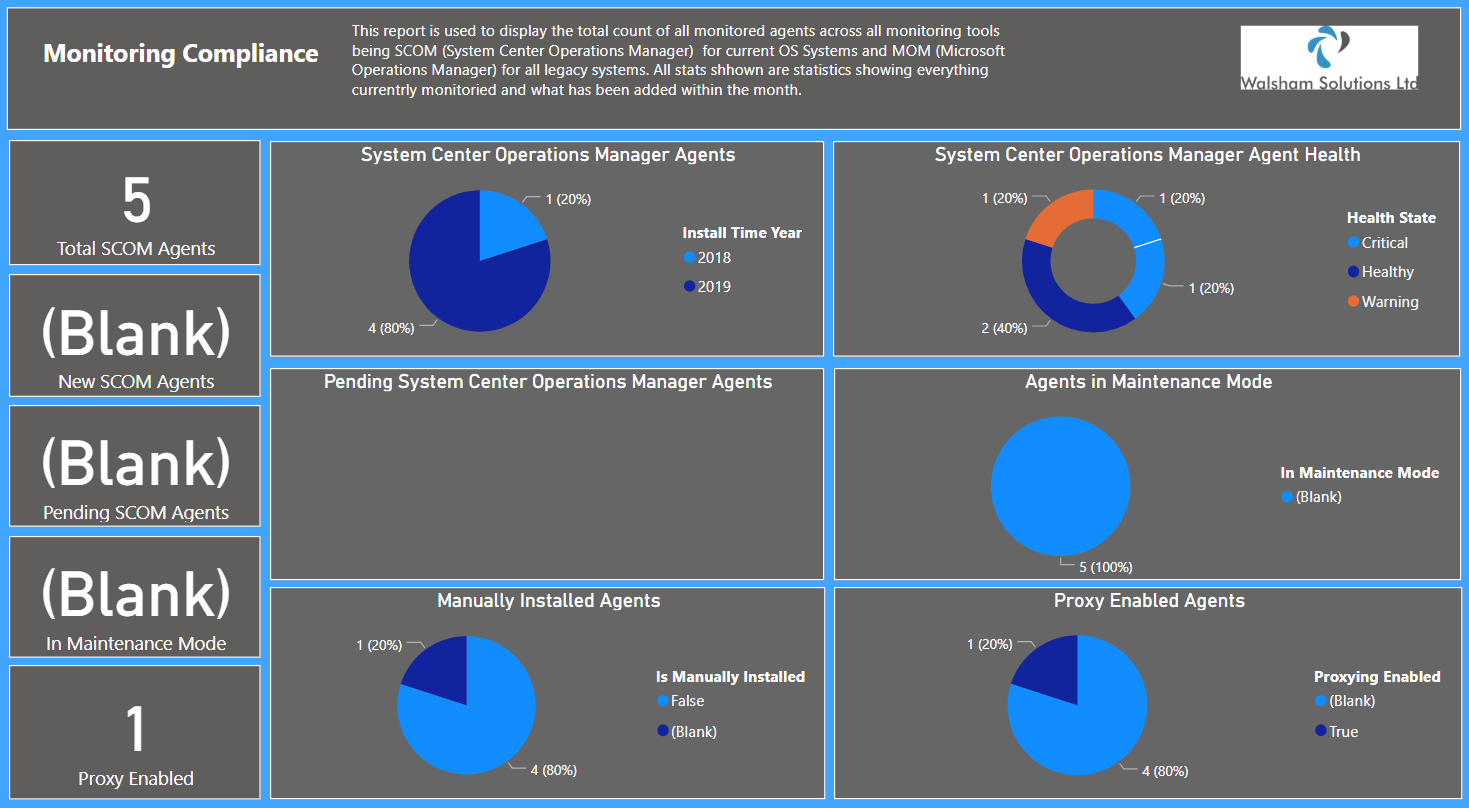
Here we have the Monitoring Compliance page which shows a chart giving a statistic breakdown of all of the SCOM managed agents within your estate. The chart gives a yearly historical breakdown which shows how many agents have been installed.
Another chart shows how many SCOM agents are within a pending state if you are perhaps using a manual agent install or is included within an image build which requires an administrator to approve from the console.
There are however several states in which the agent may be in during this chart such as;
- Updated Failed - Tried to upgrade the SCOM agent to a higher version
- Manual Approval
- Awaiting an administrator to approve the agent from the console
- Push Install Failed
- Tried to push the SCOM agent to a computer unsuccessfully
Monitoring Historical Alert Analysis
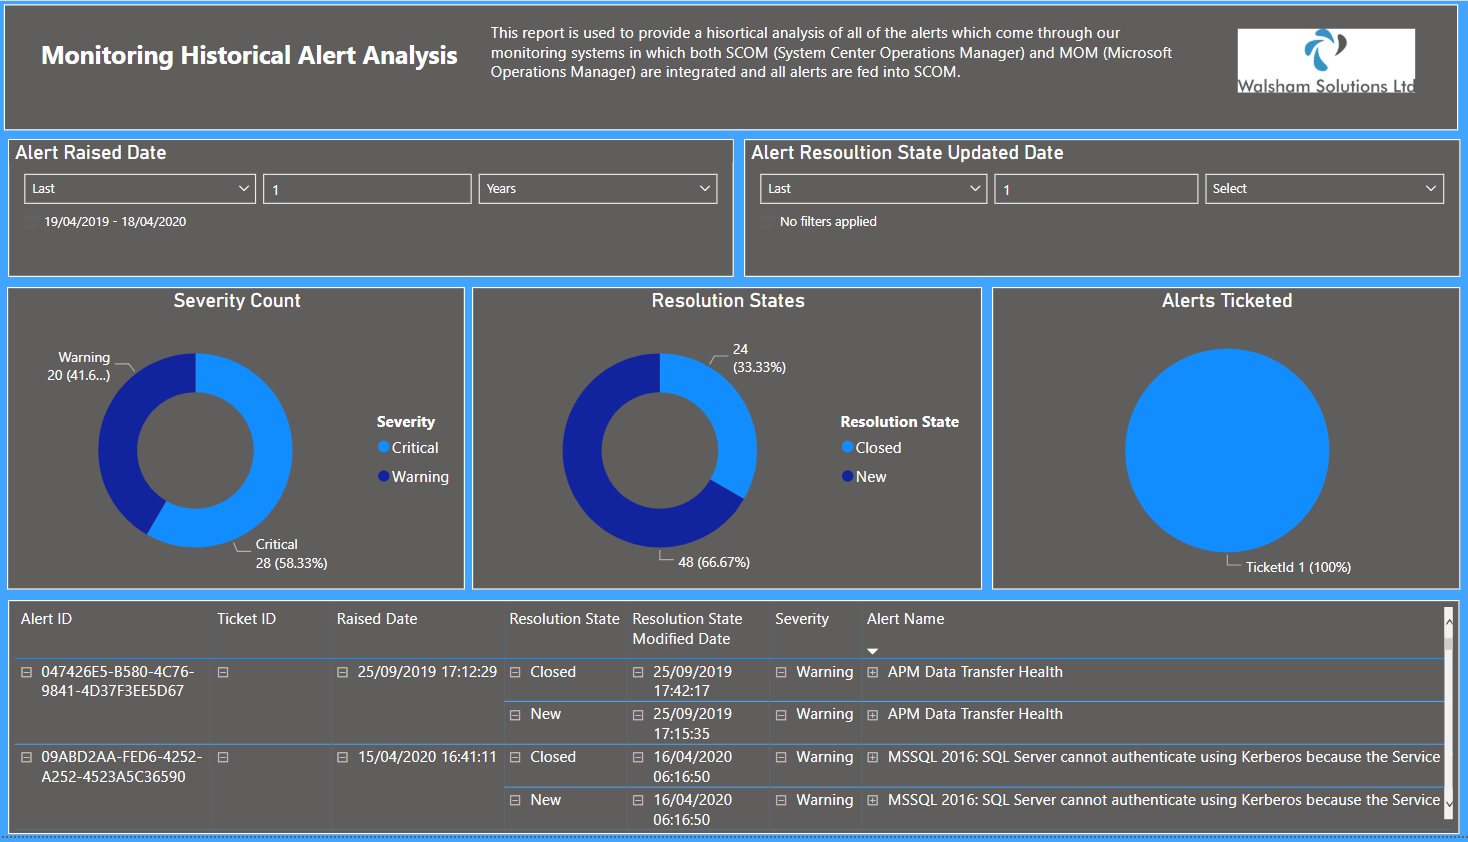
This next report is the analysis of all of the alert history within your SCOM estate. A report which can be altered over any desired time frame.
So you can change it where appropriate to show alerts over a period of time when the alert was initially created and you can also change where you can see the period of time in which the alert was resolved.
Several charts show breakdowns of other specific properties within your alerting;
- Severity Count - Shows the number of alerts which have a specific severity assigned such as Critical, Warning or Informational
- Resolution
- Shows the number of alerts which have a specific resolution state assigned to the alert from the standard resolution codes through to any custom ones which you may have configured
( Note : If you have configured any custom ones you may have to change its friendly name via the SQL query which i can explain in a section below) - Alerts Ticketed
- Optional chart if you are using a ticketing system such as Remedy, ServiceNow or SCSM etc. this chart shows how many alerts have a ticketID assigned to it for reference if needing to revert back.
- Alert ID
- Alert Created Date
- TicketID
- Alert Fixed Date
- Resolution State
- Alert Description
- Alert Name
Data Warehouse Health Compliance
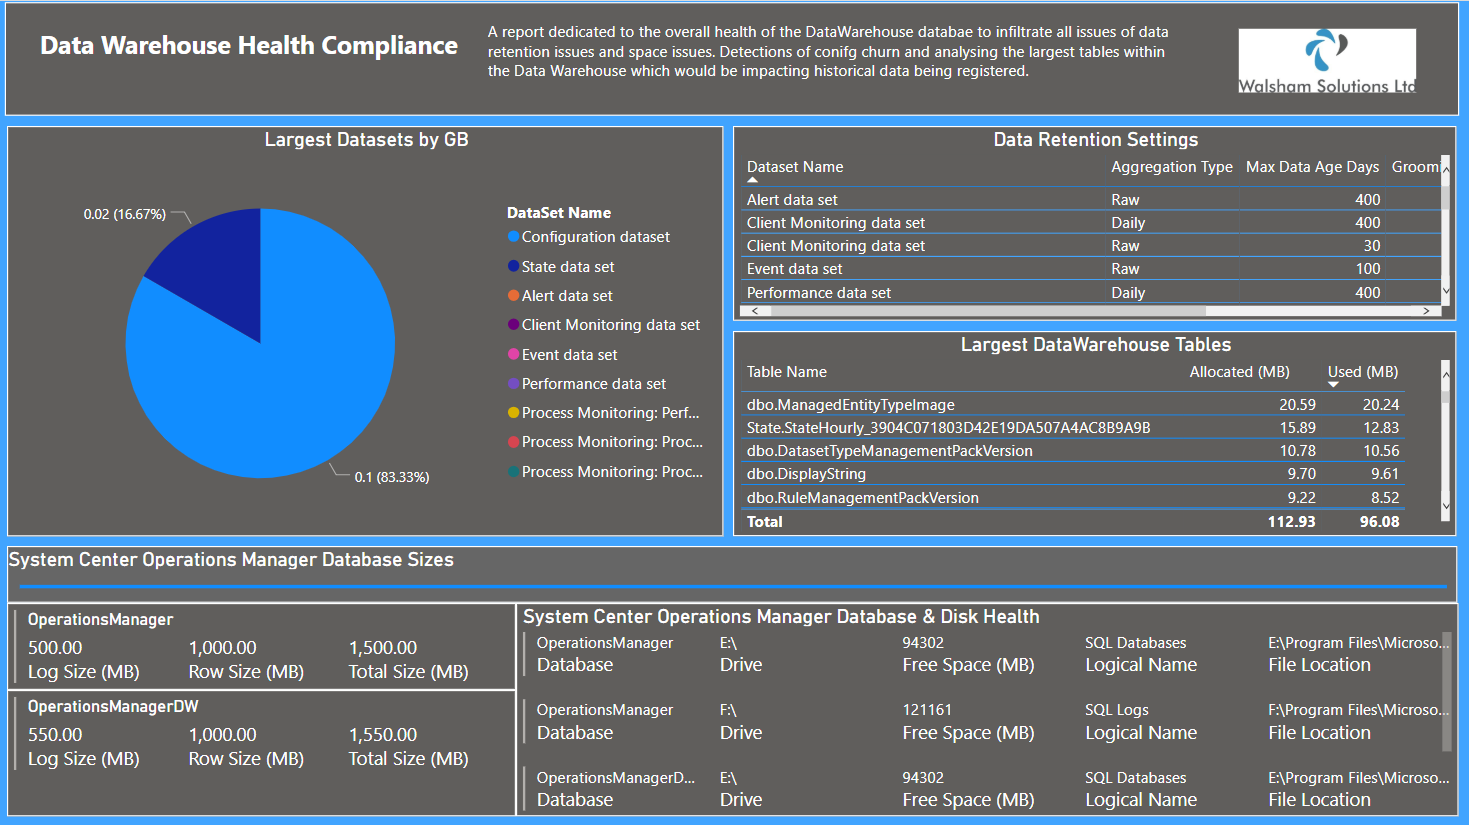
This report is a very in-depth look at the health state of your Data Warehouse.
A lot of overlooked issues tend to formulate around the Data Warehouse which keeps your historical SCOM data, and if not configured correctly or if experiencing any high level of data volumes or configuration churns can easily make your Data Warehouse database sky rocket.
There are handy tools such as the SCOM Sizing Tool for planning & also the DwDatarp.exe tool which is a great tool to analyse and configure your data retention settings to avoid this from happening.
This page provides a chart showing all of the Datatsets within your Data Warehouse and shows exactly how big each dataset is and the percentage of the database it makes up with a legend table showing which dataset it is.
Data Retention Settings
This table shows a list of all of the standard Datasets which are used to collect data to place into the Data Warehouse and stores it for a specific amount of time before clearing. This information is similar to what you would see in the DWDatarp.exe tool, here you will see the current data retention settings which you can see if you need to make adjustments to them. You will also find alerts generated from SCOM will reference DataSets or the rule which controls the dataset that places the data into the Data Warehouse have issues, this will allow you to investigate further.
Largest Data Warehouse Tables
This table shows from highest to lowest in MB how big each table is. A great way to analyse to see if any of these would be problematic when it comes to space.
System Center Operations Manager Database Sizes
Small section which shows the sizes of the database for both OperationsManager and OperationsManagerDW respectively.
System Center Operations Manager Database & Disk Health
Small section which shows the databases and where they are located as well as the free space which is left on the drives which they are placed on. There can be times in which when the databases get full for whatever reason or become unavailable, the services for SCOM (System Center Data Access Service) will shut down and cannot be started creating a windows event log stating the databases are full, or may get a warning or critical alert generated in SCOM before this happens. This section will help give an indicator if this is the case.
Monitoring Configuration Per Asset
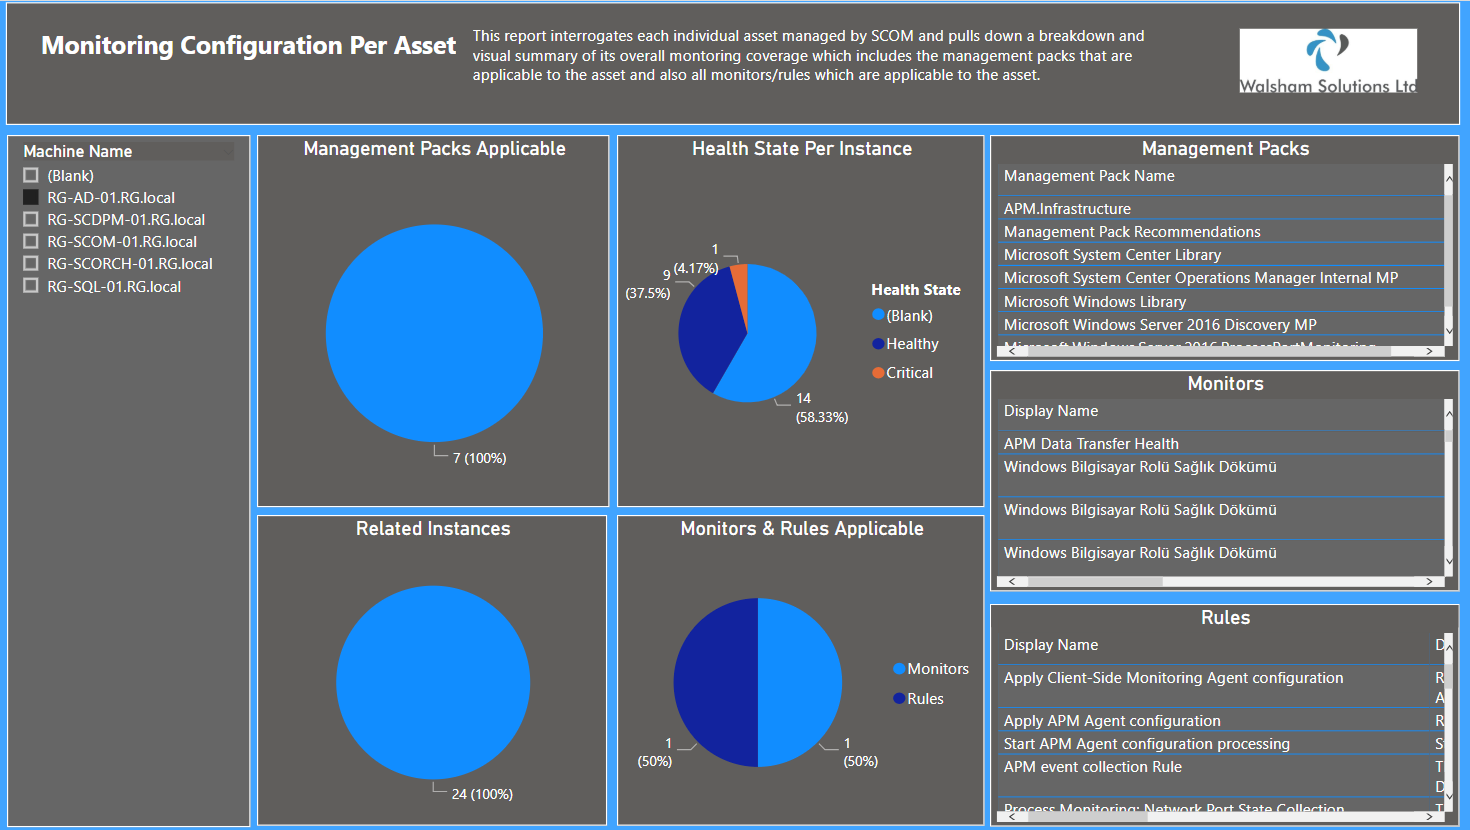
This report is similar to the export configuration powershell command and dashboard view which can show this information, but in a Power-BI related view.
From a dropdown list of all of the machines in your estate you will be provided the following details;
- Management Packs Available
- Shows the amount of management packs which this machine is applicable to. Can be seen by seeing the records. Clicking any of the management packs should filter down the Monitors and Rules which are applicable to the asset or group.
- Related Instances
- Shows the count of related objects/instances to the machine which are also monitored alongside with it i.e. the Windows Server Operating System Management pack would monitor its disk drives so you may see "C:" as a related object which is being monitored.
- Health State Per Instance
- Shows the health state of each of the related instances including the machine asset itself across all health states of Critical, Warning, Healthy as well as Not Monitored.
- Monitors & Rules Applicable
- Shows all of the monitors and rules which are applicable to the chosen machine.
This section shows a table of the related information above respectively, so you can see the actual objects which are applicable to the chose machine such as the Management Packs, Monitors and Rules.
Data Volume Compliance
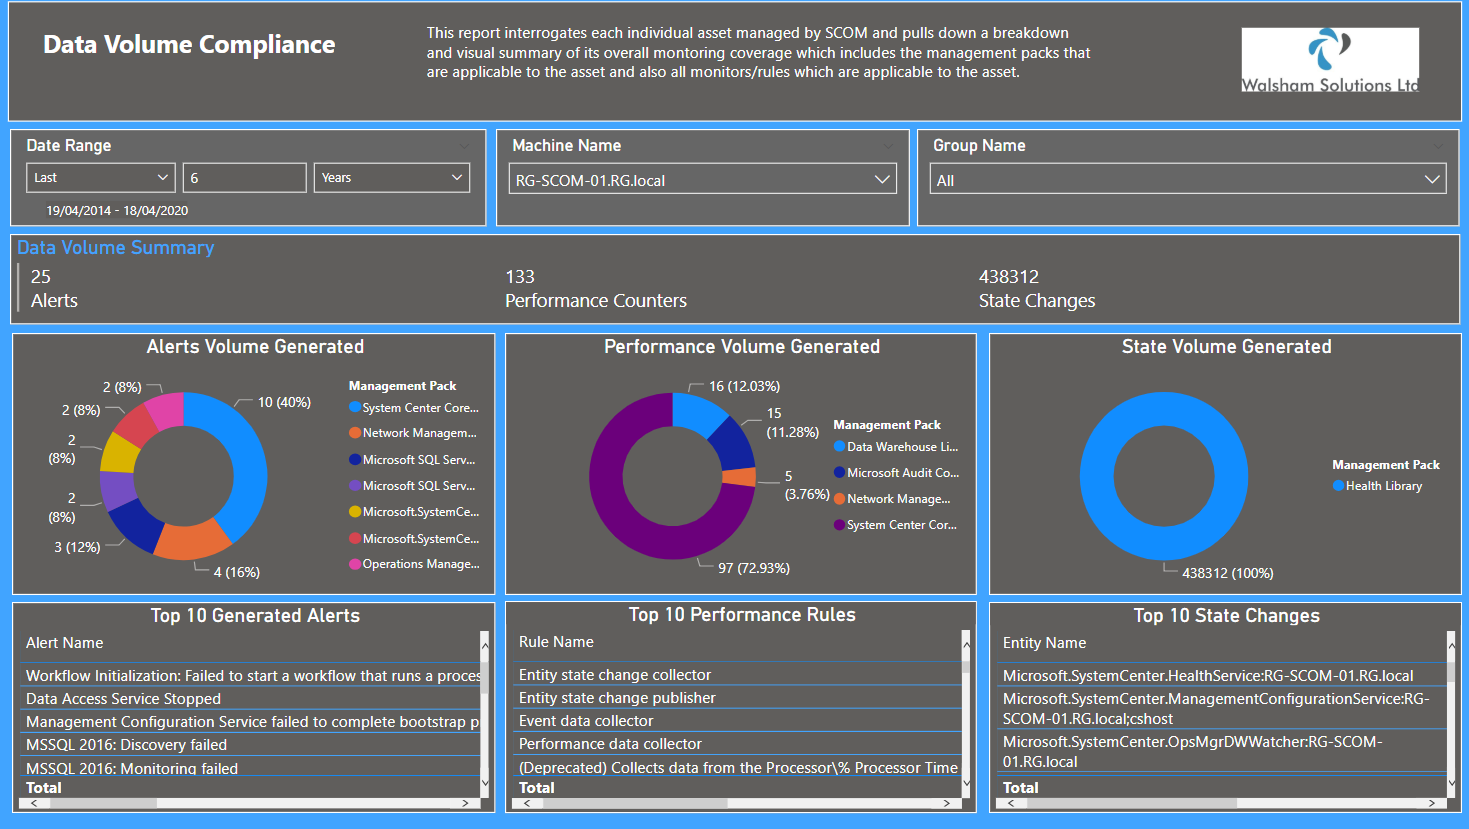
This report has a similarity to the Data Volume by Management Pack default report in SCOM, but is an alternative version and revamped report. A great way to analyse configuration churn more and having an interactive view on where noise is coming from.
Here you can adjust the date range to see all of the data which has been generated and able to see the following information;
- Alerts Volume Generated
- Performance Volume Generated
- State Volume Generated
Underneath each respective chart contains top ten tables consisting of the objects which have produced the most volume for their categories.
Below is finished with a summary table tallying up all of the statistics.
Asset Health Compliance
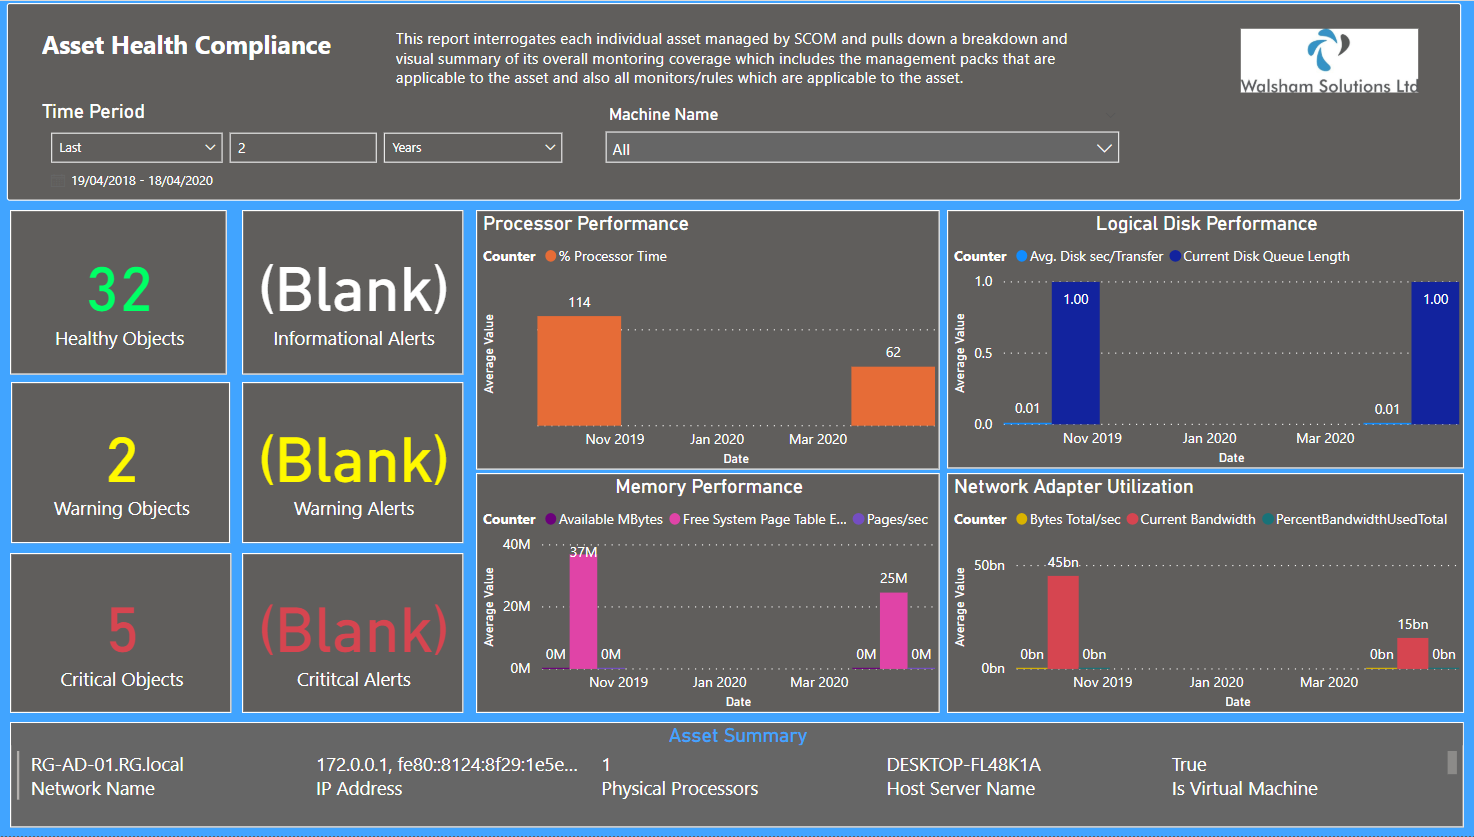
A combination of where you can also analyse the health of the Management Servers as well. Overall the Asset health page is a way to get an overall look at the health of a specific asset.
Here you will get the following;
- Asset Summary - Here you will see everything from its domain, operating system level and also its current hardware resources and network details such as IP Address/es
- Current Alerts - A table showing the current alerts which are applicable for that specific asset
- Current Utilisation - Similar to the Performance by Utilisation report, where you can see an interactive chart which can go through the CPU, Memory, Hard Disk and Network Utilisation over a specific time period specified by the end user.
Troubleshooting
Queries Taking too Long
Some datasets may be pulling not just 100s of millions but maybe billions! Depending on how big your SCOM datasets are. If you are finding that your queries are taking too long i have left some lines within the query which are commented which allow you to only pull data which is younger than a certain date i.e. pull data for only up to 6 months to a year.
You can remove the "--" from the comments so that you can limit the data you are pulling.
Also be mindful that if using any additional lines such as "Order By" or pulling to much data can vastly increase your TempDB into hundreds of GBs which may force you to perform a restart of your SQL Service.